
Page 20 - MayDefComp
P. 20
YTD
2019
2018
2017
2016
2015
2014
2013
Emrg Mrkt Fixed Large Cap Cash EM Equity Small Cap REITS REITS Small Cap Income Equity 31.49 1.82 37.28 21.31 3.20 30.14 38.82 3.15 18.22 Int'l Cash REITS Fixed Income High Yield Large Cap Large Cap Large Cap REITS Equity 0.47 26.00 0.01 17.13 1.38 13.69 32.39 25.03 Fixed Fixed Int'l Int'l High Yield Small Cap High Yield Large Cap Large Cap Income Income Equity Equity ‐12.68 25.52 ‐2.08 21.83 11.96 0.55 5.97 22.78 17.32 Int'l Asset Asset Asset Alloc. Large Cap Small Cap Comdty Cash Small Ca
2012 18.06 16.00 4.21 Cash 0.08 ‐1.06
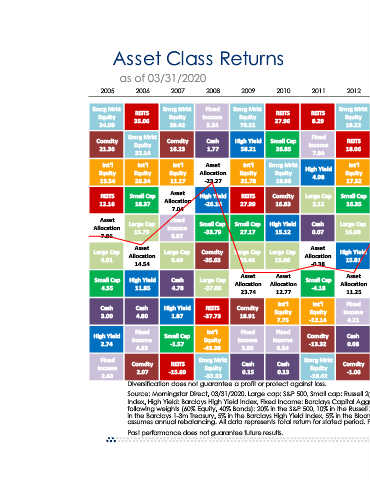
2011 REITS 8.29 Fixed Income 7.84 High Yield 4.98 Large Cap 2.11 Cash 0.07 Asset Allocation ‐0.38 Small Cap ‐4.18 Int'l Equity ‐12.14 Comdty ‐13.32 Emrg Mrkt Equity ‐18.42 following weights (60% Equity, 40% Bonds): 20% in the S&P 500, 10% in the Russell 2000, 15% in the MSCI, 5% in the MSCI EME, 30% assumes annual rebalancing. All data represents total return for stated period. Past performance is not indicative of future returns.
2010 REITS 27.96 Small Cap 26.85 Emrg Mrkt Equity 18.88 Comdty 16.83 High Yield 15.12 Large Cap 15.06 Asset Allocation 12.77 Int'l Equity 7.75 Fixed Income 6.54 Cash 0.13
Asset Class Returns
Emrg Mrkt Equity 78.51 High Yield 58.21 Int'l Equity 31.78 REITS Small Cap 27.17 Large Cap Asset Allocation 23.74 Comdty Fixed Income
2009 27.99 26.46 18.91 5.93 Cash 0.15
2008 Fixed Income 5.24 Cash 1.77 Asset Allocation ‐23.27 High Yield ‐26.16 Small Cap ‐33.79 Comdty ‐35.65 Large Cap ‐37.00 REITS ‐37.73 Int'l Equity ‐43.38 Emrg Mrkt Equity ‐53.33 Diversification does not guarantee a profit or protect against loss. Past performance does not guarantee future results.
as of 03/31/2020 2007 2006 Emrg Mrkt REITS Equity 35.06 39.42 Emrg Mrkt Comdty Equity 16.23 32.14 Int'l Int'l Equity Equity 11.17 26.34 Asset Small Cap Allocation 18.37 7.04 Fixed Large Cap Income 15.79 6.97 Asset Large Cap Allocation 5.49 14.54 Cash High Yield 4.78 11.85 High Yield Cash 1.87 4.80 Fixed Small Cap Income ‐1.57 4.33 REITS Comdty ‐15.69 2.07
2005 Emrg Mrkt Equity 34.00 Comdty 21.36 Int'l Equity 13.54 REITS 12.16 Asset Allocation 7.86 Large Cap 4.91 Small Cap 4.55 Cash 3.00 High Yield 2.74 Fixed Income 2.43