
Page 31 - MayDefComp
P. 31
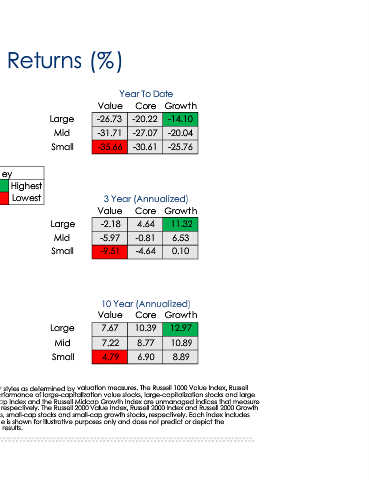
Growth  -14.10  -20.04  -25.76     Growth  11.32  6.53  0.10         Growth  12.97  10.89  8.89         and does not predict or depict the


                                 Year To Date  Core  -20.22  -27.07  -30.61  3 Year (Annualized)  Core  4.64  -0.81  -4.64  10 Year (Annualized)  Core  10.39  8.77  6.90


                       U.S. Equity Size and Style Returns (%)
                                     Value  -26.73  -31.71  -35.66      Value  -2.18  -5.97  -9.51        Value  7.67  7.22  4.79


                                         Large  Mid  Small                  Large  Mid  Small                  Large  Mid  Small


                                                               Highest  Lowest


                                                           Key                                                                    Source: Morningstar Direct, 03/31/2020. Equity style boxes are based on targeted equity styles as determined by valuation measures. The Russell 1000 Value Index, Russell  1000 Index and Russell 1000 Growth Index are unmanaged indices that measure the performance of large-capitalization value stocks, large-capitalization stocks and large  capitalization growth stocks, respectively. The Russell Midcap Value Index, Russell Midcap Index and the Russell Midcap Growth Index are unmanaged indices that me


                                     Growth  -14.10  -20.04  -25.76     Growth  0.91  -9.45  -18.58       Growth  10.36  5.61  1.70          reinvested dividends and cannot be purchased directly by investors. Index performance is shown for illustrative purposes only


                                 Quarter 1  Core  -20.22  -27.07  -30.61  1 Year (Annualized)  Core  -8.03  -18.31  -23.99  5 Year (Annualized)  Core  6.22  1.85  -0.25


                                     Value  -26.73  -31.71  -35.66      Value  -17.17  -24.13  -29.64     Value  1.90  -0.76  -2.42 Diversification does not guarantee a profit or protect against loss.   performance of any particular investment. Past performance does not guarantee future results.


                            as of 03/31/2020  Large  Mid  Small             Large  Mid  Small                  Large  Mid  Small