
Page 34 - MayDefComp
P. 34
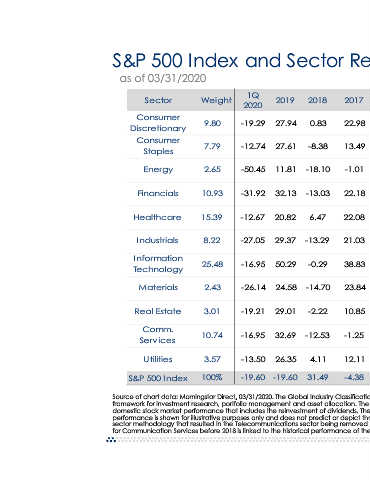
S&P 500 Index and Sector Returns (%)
                                   2017  2010  2011  2012  2013  2014  2015  2016  27.66  6.13  23.92  43.08  9.68  10.11  6.03  22.98  14.11  13.99  10.76  26.14  15.98  6.60  5.38  13.49  20.46  4.72  4.61  25.07  -7.78  -21.12  27.36  -1.01  12.13  -17.06  28.82  35.63  15.20  -1.53  22.80  22.18  2.90  12.73  17.89  41.46  25.34  6.89  -2.69  22.08  26.73  -0.59  15.35  40.68  9.83  -2.53  18.86  21.03  10.19  2.41  14.82  28.43  20.12  5.92  13.85  38.83  22.20  -9.75  14.97  25.60  6.91  -8.38  16.69  23.84  32.32  11.39  19.74  1.60  30.19  4.68  3.39  10.85  18.97  6.27  18.31  11.47  2.99  3.40  23.49  -1.25  5.46


                                   2018   0.83    -8.38   -18.10  -13.03  6.47   -13.29  -0.29   -14.70  -2.22  -12.53  4.11  31.49    framework for investment research, portfolio management and asset allocation. The GICS structure consists of 10 sectors. The S&P domestic stock market performance that includes the reinvestment of dividends. The index is unmanaged and cannot be purchased performance is shown for illustrative purposes only and does not predict or depict the performance of any particular investment.


                                   2019   27.94   27.61   11.81   32.13  20.82   29.37   50.29   24.58   29.01  32.69   26.35  -19.60


                                 1Q   2020  -19.29  -12.74  -50.45  -31.92  -12.67  -27.05  -16.95  -26.14  -19.21  -16.95  -13.50  -19.60


                                   Weight   9.80  7.79    2.65    10.93  15.39   8.22    25.48   2.43    3.01   10.74   3.57  100%


                            as of 03/31/2020  Sector  Consumer  Discretionary  Consumer  Staples  Energy  Financials  Healthcare  Industrials  Information   Technology  Materials  Real Estate  Comm.   Services  Utilities  S&P 500 Index