
Page 37 - MayDefComp
P. 37
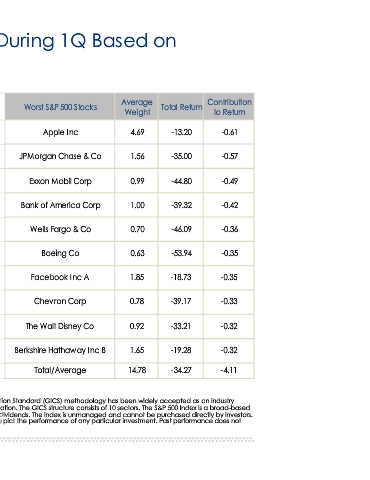
Contribution   to Return  -0.61  -0.57  -0.49  -0.42  -0.36  -0.35  -0.35  -0.33  -0.32  -0.32  -4.11


                                     Total Return  -13.20  -35.00  -44.80  -39.32  -46.09  -53.94  -18.73  -39.17  -33.21  -19.28  -34.27


                Best & Worst S&P 500 Stocks During 1Q Based on


                                   Average   Weight  4.69  1.56  0.99  1.00   0.70    0.63    1.85    0.78    0.92    1.65  14.78


                                     Worst S&P 500 Stocks  Apple Inc  JPMorgan Chase & Co  Exxon Mobil Corp  Bank of America Corp  Wells Fargo & Co  Boeing Co  Facebook Inc A  Chevron Corp  The Walt Disney Co  Berkshire Hathaway Inc B  Total/Average


                                   Contribution   to Return  0.16  0.09  0.07  0.05  0.03  0.03  0.02  0.02   0.01    0.01  0.48      Source of chart data: Morningstar Direct, 03/31/2020. The Global Industry Classification Standard (GICS) methodology has been widely accepted as an industry  analysis framework for investment research, portfolio management and asset allocation. The GICS structure consists of 10 sectors. The S&P 500 Index is a broad-based  measure of domestic stock market performance that includes the reinvestment of dividends. The index is unmanaged and cannot be purchased directly by investors.  Index perform


                                     Total Return  5.51  16.05  12.10  16.19  30.04   6.10    8.68    17.02   25.38   28.02  16.51
                       Contribution to Return


                                   Average   Weight  3.07  0.59  0.59  0.32   0.12    0.43    0.22    0.10    0.05    0.05  5.54  The mention of specific companies does not constitute a recommendation.


                            as of 03/31/2020  Best S&P 500 Stocks  Amazon.com Inc  Netflix Inc  NVIDIA Corp  Gilead Sciences Inc  Regeneron   Pharmaceuticals Inc  Eli Lilly and Co  Vertex Pharmaceuticals Inc  Digital Realty Trust Inc  NortonLifeLock Inc  Citrix Systems Inc  Total/Average  guarantee future results.