
Page 62 - MayDefComp
P. 62
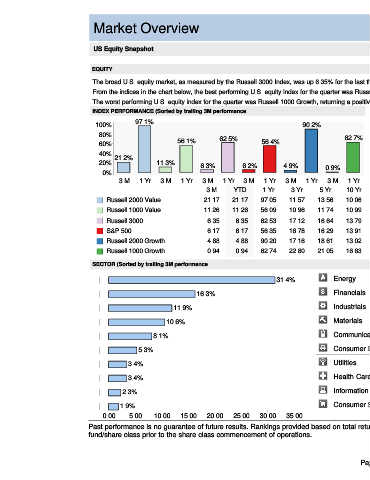
Market Overview                                                                                                                                                   3/31/2021


                                US Equity Snapshot


                                EQUITY
                               The broad U.S. equity market, as measured by the Russell 3000 Index, was up 6.35% for the last three months.
                               From the indices in the chart below, the best performing U.S. equity index for the quarter was Russell 2000 Value, returning a positive 21.17%.
                               The worst performing U.S. equity index for the quarter was Russell 1000 Growth, returning a positive 0.94%
                               INDEX PERFORMANCE (Sorted by trailing 3M performance)                                          GROWTH VS. VALUE

                                100%          97.1%                                                  90.2%                     50%                                     Growth Outperforms
                                                                                                                               40%
                                 80%                                     62.5%                                     62.7%       30%
                                 60%                       56.1%                       56.4%                                   20%
                                 40%                                                                                           10%
                                       21.2%                                                                                    0%
                                 20%                 11.3%         6.3%          6.2%         4.9%                             10%
                                   0%                                                                       0.9%               20%                                     Value Outperforms
                                        3 M    1 Yr   3 M    1 Yr   3 M   1 Yr   3 M    1 Yr   3 M    1 Yr   3 M    1 Yr         4/09       12/10 12/11 12/12 12/13 12/14 12/15 12/16 12/17 12/18 12/19               3/21
                                                                     3 M      YTD       1 Yr     3 Yr     5 Yr     10 Yr
                                                                                                                                Within the last 1 Year, growth stocks outperformed value stocks by 6.65%.
                                    Russell 2000 Value              21.17    21.17     97.05    11.57     13.56    10.06        For the trailing 3 months, value stocks outperformed growth stocks by 10.32%.
                                    Russell 1000 Value              11.26    11.26     56.09    10.96     11.74    10.99
                                                                                                                                The graph above is plotted using a rolling one year time period. Growth stock performance
                                    Russell 3000                     6.35      6.35    62.53    17.12     16.64    13.79        is represented by the Russell 1000 Growth Index. Value stock performance is represented
                                    S&P 500                          6.17      6.17    56.35    16.78     16.29    13.91        by the Russell 1000 Value Index.
                                    Russell 2000 Growth              4.88      4.88    90.20    17.16     18.61    13.02
                                    Russell 1000 Growth              0.94      0.94    62.74    22.80     21.05    16.63

                               SECTOR (Sorted by trailing 3M performance)                                                                                 3 M        YTD        1 Yr       3 Yr      5 Yr       10 Yr

                                                                                            31.4%              Energy                                    31.42      31.42      79.86      -6.32      -1.48      -2.30

                                                                  16.3%                                        Financials                                16.32      16.32      68.09       9.42      15.34      12.09

                                                          11.9%                                                Industrials                               11.94      11.94      72.61      12.62      14.28      12.47

                                                        10.6%                                                  Materials                                 10.60      10.60      81.87      13.27      14.38       9.67

                                                   8.1%                                                        Communication Svcs.                         8.13       8.13     60.79      18.73      10.08      10.34

                                              5.3%                                                             Consumer Discretionary                      5.31       5.31     78.82      19.90      17.72      17.12

                                           3.4%                                                                Utilities                                   3.38       3.38     19.18      11.50       8.88      11.23

                                           3.4%                                                                Health Care                                 3.37       3.37     35.94      15.35      14.12      15.82
                                         2.3%                                                                  Information Technology                      2.28       2.28     67.88      28.13      27.33      20.01

                                        1.9%                                                                   Consumer Staples                            1.85       1.85     30.07      12.30       8.36      11.76
                                   0.00    5.00     10.00   15.00    20.00    25.00    30.00   35.00                                                                                         Source: S&P 1500 Sector Indices.

                              Past performance is no guarantee of future results. Rankings provided based on total returns. Performance quoted for mutual funds may include performance of a predecessor
                              fund/share class prior to the share class commencement of operations.


                                                                                                                        Page 5