Page 108 - DeferredComp-May2018
P. 108

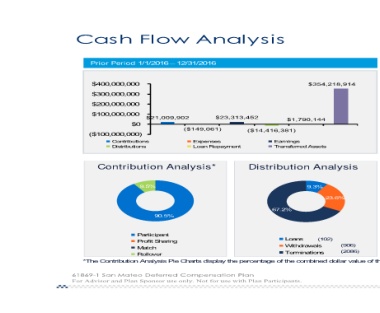
CCaashshFloFlwowAAnanlaylsyissis

              Prior Period 2/1/2010 – 11/30/2016

                  Prior Period 1/1/2016 – 12/31/2016

$400,000,000                                                                $354,218,914

$300,000,000

$200,000,000

 $100,000,000                $21,009,902  $23,313,452     $1,790,144
                         $0
                                ($149,061)                ($14,416,381)
($100,000,000)

Co n trib u tio n s                       E xpenses       Earnings
Distr ib u tio n s                        Loan Repayment  Transferred A ssets

Contribution Analysis*                                    Distribution Analysis

              9. 5%                                                         9. 3%
                        90. 5%                                                           23. 6%

                                                          67. 2%

Part ic ipant                                             Loans             (102)
Profit Sharing
M at c h                                                  W it hdraw als           (906)
R ollov er                                                                         (2086)
                                                          T erm inat ions

*The Contribution Analysis Pie Charts display the percentage of the combined dollar value of th

61869-1 San Mateo Deferred Compensation Plan
For Advisor and Plan Sponsor use only. Not for use with Plan Participants.
   103   104   105   106   107   108   109   110   111   112   113