
Page 112 - DeferredComp-May2018
P. 112
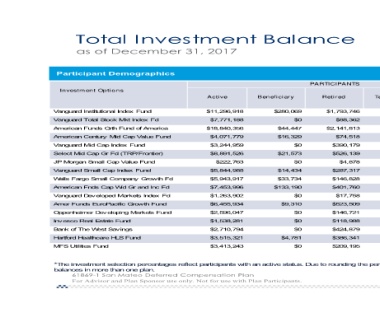
Total Investment Balance

as of December 31, 2017

 Participant Demographics             A cti ve         B en efi ci ar y  PA R TI C I PA N TS  Te
                                                                                 R eti r ed
    Investm ent Options               $11, 296, 918
                                        $7, 771, 188   $280, 069         $1, 793, 746
Vanguard Institutional Index Fund                                    $0        $88, 362
Vanguard Total Stock Mkt Index Fd     $18, 840, 356
American Funds Grth Fund of America     $4, 071, 779     $44, 447        $2, 141, 813
American Century Mid Cap Value Fund     $3, 244, 959     $16, 329              $74, 518
Vanguard Mid Cap Index Fund             $8, 891, 526
Select Mid Cap Gr Fd (TRP/Frontier)         $222, 763                $0      $390, 179
JP Morgan Small Cap Value Fund          $5, 844, 988     $21, 573            $526, 139
Vanguard Small Cap Index Fund           $5, 943, 917
Wells Fargo Small Company Grow th Fd    $7, 453, 996                 $0           $4, 878
American Fnds Cap Wld Gr and Inc Fd     $1, 263, 902     $14, 434            $287, 317
Vanguard Dev eloped Markets Index Fd    $6, 455, 934     $33, 734            $146, 828
Amer Funds EuroPacific Grow th Fund     $2, 596, 047   $133, 190             $401, 760
Oppenheimer Dev eloping Markets Fund    $1, 538, 281
Inv esco Real Estate Fund               $2, 710, 794                 $0        $17, 758
Bank of The West Sav ings               $3, 515, 321        $9, 310          $523, 509
Hartford Healthcare HLS Fund            $3, 413, 243                         $146, 721
MFS Utilities Fund                                                   $0      $118, 988
                                                                     $0      $424, 879
                                                                     $0      $386, 341
                                                            $4, 781          $209, 195
                                                                     $0

*The investment selection percentages reflect participants with an active status. Due to rounding the perc
balances in more than one plan.

             61869-1 San Mateo Deferred Compensation Plan

             For Advisor and Plan Sponsor use only. Not for use with Plan Participants.