
Page 111 - DeferredComp-May2018
P. 111
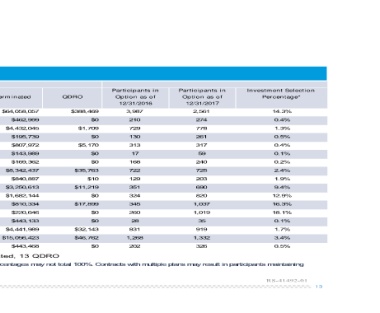
erm inated          QD R O                  Participants in    Participants in    Investm ent Selection
                                              Option as of       Option as of               Per cen tag e*
  $64, 058, 057           $388, 469              12/ 31/ 2016       12/ 31/ 2017
         $462, 999                      $0            3, 987             2, 561                     14. 3%
                                                        210                274                       0. 4%
     $4, 432, 045              $1, 709                  729                778                       1. 3%
         $195, 739                      $0              130                261                       0. 5%
         $807, 972                                      313                317                       0. 4%
         $143, 989             $5, 170                   17                 59                       0. 1%
         $169, 362                      $0              168                240                       0. 2%
                                        $0              722                725                       2. 4%
     $8, 342, 437                                       129                203                       1. 9%
         $840, 887          $35, 763                    351                690                       9. 4%
                                      $10               324                820
     $3, 250, 613                                       345              1, 037                     12. 9%
     $1, 682, 144           $11, 219                    260              1, 019                     16. 3%
                                        $0               28                 35                      18. 1%
         $810, 334                                      831                919
         $220, 646          $17, 899                  1, 268             1, 332                      0. 1%
         $443, 133                      $0              202                326                       1. 7%
     $4, 441, 989                       $0                                                           3. 4%
  $15, 056, 423                                                                                      0. 5%
         $443, 468          $32, 143
                            $46, 762

                                        $0

ated, 13 QDRO
  centages may not total 100%. Contracts with multiple plans may result in participants maintaining

                                                                                  RS-41492-01

                                                                                                            13