
Page 29 - DecDefComp
P. 29
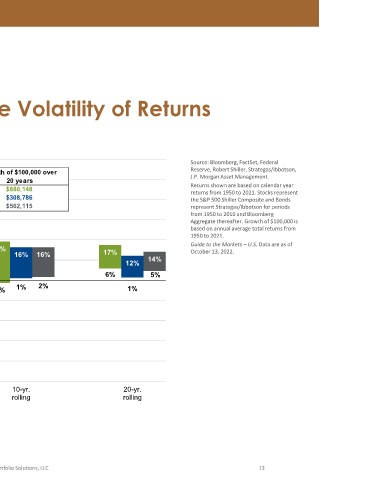
Source: Bloomberg, FactSet, Federal  Reserve, Robert Shiller, Strategas/Ibbotson,  J.P. Morgan Asset Management. Returns shown are based on calendar year  returns from 1950 to 2021. Stocks represent  the S&P 500 Shiller Composite and Bonds  represent Strategas/Ibbotson for periods  from 1950 to 2010 and Bloomberg  Aggregate thereafter. Growth of $100,000 is  based on annual average total returns from   1950 to 2021. Guide to the Markets –U.S. Data are as of   October 13, 2022.  13


                                       Time, Diversification and the Volatility of Returns


                                                                                       14%  5%


                                                                                         12%     1%                               20-yr.  rolling


                                                                                     17%    6%


                                                           Growth of $100,000 over   20 years  $880,148  $308,786  $562,115  19%  16%  16%  2%  1%  -1%  10-yr.  rolling  © 2022 Innovest Portfolio Solutions, LLC


                                                           Annual avg.   total return  11.5%  5.8%  9.0%  21%  1%

                                             Range of stock, bond and blended total returns


                                                                      50/50 portfolio  23%       -2%                              5-yr.  rolling


                                                                Stocks  Bonds  28%               -3%


                                                2021                43%    33%                   -8%  -15%                        1-yr.


      Investing Fundamentals                    Annual total returns, 1950 ‐  60%  50%  47%  40%  30%  20%  10%  0%  -10%  -20%  -30%  -39%  -40%  -50%