
Page 359 - DCAC February 2024 Files
P. 359
1.2 150.0
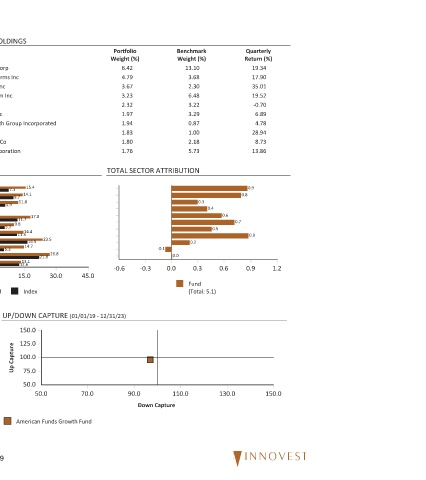
Quarterly Return (%) 19.34 17.90 35.01 19.52 -0.70 6.89 4.78 28.94 8.73 13.86 0.9 0.9 0.9
0.8
0.7
0.6 0.6 130.0
0.5
0.4 0.3 (Total: 5.1)
Benchmark Weight (%) 13.10 3.68 2.30 6.48 3.22 3.29 0.87 1.00 2.18 5.73 0.2 -0.1 0.0 0.3 0.0 Fund 110.0
Portfolio Weight (%) 6.42 4.79 3.67 3.23 2.32 1.97 1.94 1.83 1.80 1.76 TOTAL SECTOR ATTRIBUTION -0.3 -0.6 90.0 Down Capture
45.0 30.0 (01/01/19 - 12/31/23) 70.0 American Funds Growth Fund
26.8
23.5
21.8
TOP 10 HOLDINGS Microsoft Corp Meta Platforms Inc Broadcom Inc Amazon.com Inc Tesla Inc Alphabet Inc UnitedHealth Group Incorporated Netflix Inc Eli Lilly and Co NVIDIA Corporation 15.4 7.3 14.1 9.7 11.8 5.9 -6.6 -8.0 17.8 11.7 9.8 5.7 14.4 11.3 16.5 14.7 5.3 13.1 12.6 15.0 0.0 -15.0 Index Fund UP/DOWN CAPTURE 150.0 125.0 100.0 Up Capture 75.0 50.0 50.0 49
Benchmark $1,193,775 $46,246 33.94 9.67 21.19 0.72 1.00 2.53 N/A 225 SECTOR PERFORMANCE -30.0 Large Cap Growth Small Cap Growth Average Style Exposure
45.0
American Funds Growth Fund 12/31/23
36.2
Portfolio $518,120 $36,296 26.55 5.73 19.66 0.75 0.98 10.75 52.60 331 24.1 30.0 Manager Style
18.5 Index
12.2 10.3 13.6 17.0 11.9 15.0 Dec-2023
7.6 6.8 9.0 7.4
6.3 2.3 5.2 5.2 2.5 1.9 0.2 0.8 0.6 0.5 0.0 Fund
PORTFOLIO CHARACTERISTICS Wtd. Avg. Mkt. Cap $M Median Mkt. Cap $M Price/Earnings ratio Price/Book ratio 5 Yr. EPS Growth Rate (%) Current Yield (%) Beta (5 Years, Monthly) % in Int'l Securities Active Share Number of Stocks SECTOR ALLOCATION Communication Services Consumer Discretionary Consumer Staples Energy Financials Health Care Industrials Information Technology Materials Real Estate Utilitie