
Page 409 - DCAC February 2024 Files
P. 409
2.4
Standard Deviation 0.22 0.22 0.21 2016 (95) 3 Years Ending Dec-2017 (99)
1.8 N/A 1.39 1.82 N/A 1.38 1.80
1.2 0.6 Risk (Standard Deviation %) Return 2.70 2.08 2.36 2017 (2) (95) 3 Years Ending Dec-2018 (93)
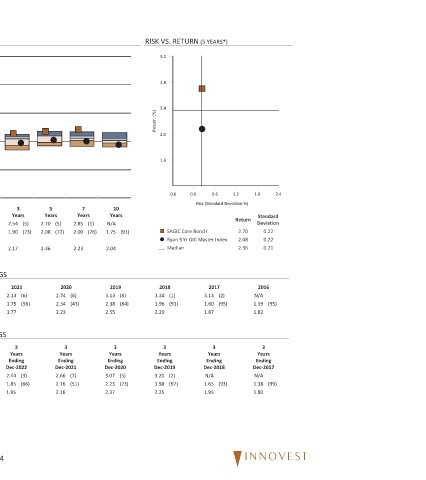
RISK VS. RETURN (5 YEARS*) 3.2 2.8 2.4 2.0 1.6 0.0 -0.6 SAGIC Core Bond I Ryan 3 Yr GIC Master Index Median 2018 3.13 (1) 3.34 1.60 (91) 1.96 1.87 2.20 3 Years Ending Dec-2019 N/A (2) 3.20 1.65 (97) 1.98 1.95 2.25
Return (%)
(91) (8) (84) (5) (73)
10 Years N/A 1.75 2.04 2019 3.13 2.38 2.55 3 Years Ending Dec-2020 3.07 2.23 2.37
(1) (76)
7 Years 2.85 2.00 2.23 (43)
2020 (6) 3 Years Ending Dec-2021 (7) (51)
(5) (72) 2.74 2.34 2.23 2.66 2.16 2.16
5 Years 2.70 2.08 2.36
(5) (73) (6) (56) (3) (66)
Years
3 2.54 1.90 2.17 2021 2.13 1.75 1.77 3 Years Ending Dec-2022 2.44 1.85 1.95
74
(27) (78)
Year
1
PEER GROUP ANALYSIS - IM U.S. GIC/Stable Value (SA+CF)
3.06 2.47 2.82 (3) (87) (5) (73)
2022 2.45 1.46 1.95 3 Years Ending Dec-2023 2.54 1.90 2.17
(78)
(27)
Year To Date 3.06 2.47 2.82
Last Quarter (23) 0.89 (29) 0.75 0.74 CALENDAR YEAR RETURNS AND PERCENTILE RANKINGS ROLLING 3 YEAR RETURNS AND PERCENTILE RANKINGS
8.0 6.0 4.0 Return 2.0 0.0 -2.0 IM U.S. GIC/Stable Value (SA+CF) Median IM U.S. GIC/Stable Value (SA+CF) Median
SAGIC Core Bond I Ryan 3 Yr GIC Master Index Median SAGIC Core Bond I Ryan 3 Yr GIC Master Index SAGIC Core Bond I Ryan 3 Yr GIC Master Index
SAGIC Core Bond I 12/31/23 FUND INFORMATION Investment Strategy: The Core Bond I invests in a diversified portfolio of primarily investment-grade fixed income securities, with the potential of up to 25% of assets in below investment -grade debt securities. The portfolio manager uses a core-plus fixed income strategy to seek a superior total rate of return by investing in securities with attractive yields, including, but