
Page 363 - DCAC Feb 2026 Files
P. 363
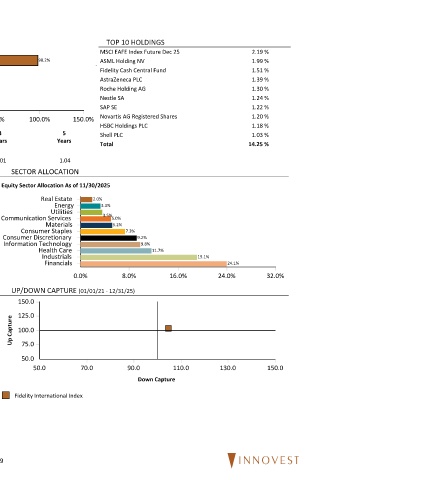
Fidelity International Index 12/31/25

     PORTFOLIO CHARACTERISTICS      ASSET ALLOCATION  TOP 10 HOLDINGS
 Total Securities  706  MSCI EAFE Index Future Dec 25     2.19 %
 Avg. Market Cap  $64,405 Million  Equity  98.2%  ASML Holding NV  1.99 %
 P/E  15.34             Fidelity Cash Central Fund        1.51 %
 Cash  1.6%
 P/B  1.99              AstraZeneca PLC                   1.39 %
 Div. Yield  3.20%  Others  0.2%  Roche Holding AG        1.30 %
     TOP 5 COUNTRIES    Nestle SA                         1.24 %
 Fixed Income  0.0%
 Japan  22.71 %         SAP SE                            1.22 %
 United Kingdom  14.43 %  0.0%  50.0%  100.0%  150.0%  Novartis AG Registered Shares  1.20 %
 France  9.83 %         HSBC Holdings PLC                 1.18 %
 Switzerland  9.62 %  3  5  Shell PLC                     1.03 %
 Years        Years
 Germany  9.55 %        Total                            14.25 %
 vs. MSCI EAFE (Net)
 Total  66.14 %
 Beta  1.01   1.04
 REGION ALLOCATION        SECTOR ALLOCATION
  Equity Sector Allocation As of 11/30/2025
 EMEA  59.1%  Real Estate  2.0%                                                                                                                                  Real Estate  2.0%
             Energy     3.3%                                                                                                                                                3.3%
            Utilities                                                                                                                                               Energy
  Communication Services  3.5% 5.0%                                                                                                                                Utilities  3.5%
 Asia Pacific  29.1%  Materials  5.2%                                                                                                                   Communication Services  5.0%
      Consumer Staples       7.3%                                                                                                                                 Materials  5.2%
  Consumer Discretionary        9.2%                                                                                                                        Consumer Staples   7.3%
  Information Technology         9.8%                                                                                                                   Consumer Discretionary
 Other    Health Care              11.7%                                                                                                                                        9.2%
 11.9%    Industrials                         19.1%                                                                                                     Information Technology  9.8%
           Financials                               24.1%                                                                                                       Health Care       11.7%
                                                                                                                                                                 Industrials           19.1%
 0.0%  15.0%  30.0%  45.0%  60.0%  75.0%  0.0%  8.0%  16.0%  24.0%  32.0%
                                                                                                                                                                 Financials               24.1%
 STYLE MAP (10/01/11 - 12/31/25)  UP/DOWN CAPTURE (01/01/21 - 12/31/25)                                                                                                 0.0%      15.0%     30.0%
     150.0
 MSCI EAFE Value Index  MSCI EAFE Growth Index  125.0
 Capitalization  Up Capture     100.0

      75.0
      50.0
 MSCI EAFE Small Cap  MSCI Emerging Markets Index
         50.0      70.0       90.0      110.0      130.0     150.0
 Manager Style                  Down Capture
 Style History  Dec-2025  Average Style Exposure  Fidelity International Index


 59