
Page 368 - DCAC Feb 2026 Files
P. 368
Invesco Dev Mkt 12/31/25
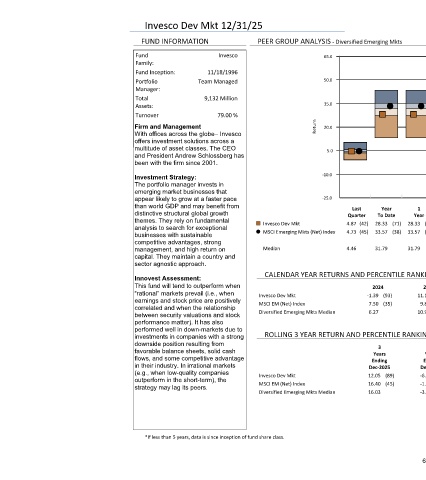
FUND INFORMATION PEER GROUP ANALYSIS - Diversified Emerging Mkts RISK VS. RETURN (5 YEARS*)
Fund Invesco 65.0 15.0
Family:
Fund Inception: 11/18/1996
Portfolio Team Managed 50.0 10.0
Manager:
Total 9,132 Million
Assets: 35.0
5.0
Turnover 79.00 %
Firm and Management Return 20.0 Return (% )
With offices across the globe– Invesco 0.0
offers investment solutions across a
multitude of asset classes. The CEO 5.0
and President Andrew Schlossberg has
been with the firm since 2001. -5.0
Investment Strategy: -10.0
The portfolio manager invests in
emerging market businesses that -10.0
appear likely to grow at a faster pace -25.0 4.0 8.0 12.0 16.0 20.0 24.0
than world GDP and may benefit from Last Year 1 3 5 7 10 Risk (Standard Deviation %)
distinctive structural global growth Quarter To Date Year Years Years Years Years
themes. They rely on fundamental ¢ £ Invesco Dev Mkt 4.87 (42) 28.33 (71) 28.33 (71) 12.05 (89) -0.53 (91) 5.09 (97) 6.00 (92) Return Standard
analysis to search for exceptional MSCI Emerging Mkts (Net) Index 4.73 (45) 33.57 (38) 33.57 (38) 16.40 (45) 4.20 (46) 8.06 (54) 8.42 (40) Deviation
businesses with sustainable ¢ £ Invesco Dev Mkt -0.53 16.13
competitive advantages, strong MSCI Emerging Mkts (Net) Index 4.20 15.29
management, and high return on Median 4.46 31.79 31.79 16.03 3.93 8.23 8.01 ¾ Median 3.93 15.45
capital. They maintain a country and
sector agnostic approach.
CALENDAR YEAR RETURNS AND PERCENTILE RANKINGS
Innovest Assessment:
This fund will tend to outperform when 2024 2023 2022 2021 2020 2019 2018
“rational” markets prevail (i.e., when Invesco Dev Mkt -1.39 (93) 11.17 (49) -25.16 (71) -7.50 (85) 17.22 (55) 23.99 (28) -12.14 (12)
earnings and stock price are positively MSCI EM (Net) Index 7.50 (35) 9.83 (61) -20.09 (31) -2.54 (59) 18.31 (48) 18.42 (65) -14.57 (30)
correlated and when the relationship Diversified Emerging Mkts Median 6.27 10.97 -22.47 -1.35 17.83 20.52 -16.37
between security valuations and stock
performance matter). It has also
performed well in down-markets due to
investments in companies with a strong ROLLING 3 YEAR RETURN AND PERCENTILE RANKINGS
downside position resulting from 3 3 3 3 3 3 3
favorable balance sheets, solid cash Years Years Years Years Years Years Years
flows, and some competitive advantage Ending Ending Ending Ending Ending Ending Ending
in their industry. In irrational markets Dec-2025 Dec-2024 Dec-2023 Dec-2022 Dec-2021 Dec-2020 Dec-2019
(e.g., when low-quality companies Invesco Dev Mkt 12.05 (89) -6.39 (84) -8.36 (73) -6.73 (92) 10.37 (73) 8.49 (31) 13.66 (20)
outperform in the short-term), the MSCI EM (Net) Index 16.40 (45) -1.92 (40) -5.08 (45) -2.69 (43) 10.94 (64) 6.17 (46) 11.57 (40)
strategy may lag its peers.
Diversified Emerging Mkts Median 16.03 -3.07 -5.50 -3.28 11.88 5.81 10.77
*If less than 5 years, data is since inception of fund share class.
62