Page 366 - DCAC Feb 2026 Files
P. 366

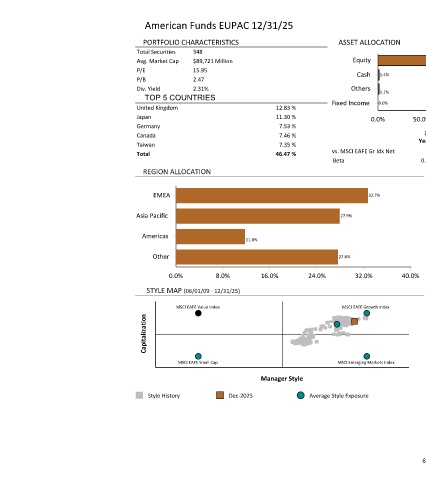
American Funds EUPAC 12/31/25

                                    PORTFOLIO CHARACTERISTICS                   ASSET ALLOCATION                         TOP 10 HOLDINGS
                                Total Securities  348                                                                   Taiwan Semiconductor Manufacturing  6.61 %
                                Avg. Market Cap  $89,721 Million                 Equity                   97.5%         Airbus SE                          2.48 %
                                P/E          15.95                                                                      SK Hynix Inc                       2.18 %
                                                                                 Cash  1.4%
                                P/B          2.47                                                                       Novo Nordisk AS Class B            1.75 %
                                Div. Yield   2.31%                              Others  1.1%                            UniCredit SpA                      1.52 %
                                    TOP 5 COUNTRIES                                                                     AstraZeneca PLC                    1.38 %
                                                                            Fixed Income  0.0%
                                United Kingdom                 12.83 %                                                  ASML Holding NV                    1.36 %
                                Japan                          11.30 %               0.0%     50.0%     100.0%   150.0%  SoftBank Group Corp               1.36 %
                                Germany                         7.53 %                                                  SAP SE                             1.35 %
                                Canada                          7.46 %                           3             5        Tencent Holdings Ltd               1.27 %
                                                                                               Years          Years
                                Taiwan                          7.35 %                                                  Total                             21.26 %
                                                                            vs. MSCI EAFE Gr Idx Net
                                Total                          46.47 %
                                                                            Beta                0.89          0.90
                                 REGION ALLOCATION                                                     SECTOR ALLOCATION
                                                                                                 Equity Sector Allocation As of 12/31/2025
                                    EMEA                                            32.7%
                                                                                                          Real Estate  0.3%                                                                                                                                      Real Estate  0.3%
                                                                                                            Utilities  1.8%                                                                                                                                        Utilities  1.8%
                                                                                                             Energy
                                Asia Pacific                                  27.9%                   Consumer Staples    3.6% 4.8%                                                                                                                                 Energy  3.6%
                                                                                                 Communication Services         6.8%                                                                                                                        Consumer Staples  4.8%
                                                                                                          Health Care             8.1%                                                                                                                  Communication Services  6.8%
                                 Americas                                                                  Materials                 9.5%
                                                        11.8%                                                                                                                                                                                                   Health Care    8.1%
                                                                                                  Consumer Discretionary             9.8%
                                                                                                          Industrials                              17.5%                                                                                                          Materials     9.5%
                                   Other                                     27.6%                Information Technology                             18.6%                                                                                              Consumer Discretionary  9.8%
                                                                                                           Financials                                 19.1%                                                                                                      Industrials          17.5%
                                                                                                                                                                                                                                                        Information Technology        18.6%
                                       0.0%       8.0%      16.0%     24.0%      32.0%      40.0%                 0.0%       6.0%      12.0%      18.0%      24.0%
                                                                                                                                                                                                                                                                 Financials            19.1%
                                  STYLE MAP (06/01/09 - 12/31/25)                                   UP/DOWN CAPTURE (01/01/21 - 12/31/25)                                                                                                                               0.0%  10.0%  20.0%  30.0%
                                                                                                     150.0
                                         MSCI EAFE Value Index                MSCI EAFE Growth Index  125.0
                                  Capitalization                                                    Up Capture     100.0
                                                                                                      75.0
                                                                                                      50.0
                                         MSCI EAFE Small Cap                 MSCI Emerging Markets Index
                                                                                                         50.0      70.0       90.0      110.0      130.0     150.0
                                                            Manager Style                                                       Down Capture
                                  Style History      Dec-2025          Average Style Exposure       American Funds EUPAC


                                                                                                61
   361   362   363   364   365   366   367   368   369   370   371