Page 371 - DCAC Feb 2026 Files
P. 371

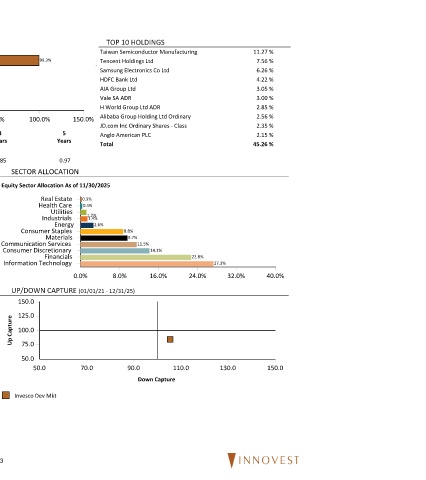
Invesco Dev Mkt 12/31/25

     PORTFOLIO CHARACTERISTICS      ASSET ALLOCATION  TOP 10 HOLDINGS
 Total Securities  93   Taiwan Semiconductor Manufacturing  11.27 %
 Avg. Market Cap  $80,961 Million  Equity  99.3%  Tencent Holdings Ltd  7.56 %
 P/E  11.25             Samsung Electronics Co Ltd         6.26 %
 Cash  0.6%
 P/B  1.76              HDFC Bank Ltd                      4.22 %
 Div. Yield  3.26%  Fixed Income  0.1%  AIA Group Ltd      3.05 %
     TOP 5 COUNTRIES    Vale SA ADR                        3.00 %
 Others  0.0%
 China  27.83 %         H World Group Ltd ADR              2.85 %
 Taiwan  15.58 %  0.0%  50.0%  100.0%  150.0%  Alibaba Group Holding Ltd Ordinary  2.56 %
 Korea  10.47 %         JD.com Inc Ordinary Shares - Class  2.35 %
 Brazil  9.99 %  3  5   Anglo American PLC                 2.15 %
 Years        Years
 India  9.91 %          Total                             45.26 %
 vs. MSCI EM (Net) Index
 Total  73.78 %
 Beta  0.85   0.97
 REGION ALLOCATION        SECTOR ALLOCATION
  Equity Sector Allocation As of 11/30/2025
 Asia Pacific  75.2%
          Real Estate  0.3%                                                                                                                                      Real Estate  0.3%
          Health Care  0.4%                                                                                                                                     Health Care  0.4%
            Utilities
 Americas  14.1%  Industrials  1.2%                                                                                                                                Utilities  1.2%
                     1.4%
             Energy   2.6%                                                                                                                                       Industrials  1.4%
      Consumer Staples       8.8%                                                                                                                                   Energy  2.6%
 EMEA      Materials          9.7%
 2.5%                                                                                                                                                       Consumer Staples  8.8%
  Communication Services        11.5%
  Consumer Discretionary           14.1%                                                                                                                          Materials   9.7%
 Other  8.3%  Financials                    22.8%                                                                                                       Communication Services  11.5%
  Information Technology                         27.3%                                                                                                  Consumer Discretionary  14.1%
                                                                                                                                                                 Financials         22.8%
 0.0%  20.0%  40.0%  60.0%  80.0%  100.0%  0.0%  8.0%  16.0%  24.0%  32.0%  40.0%
                                                                                                                                                        Information Technology        27.3%
 STYLE MAP (01/01/01 - 12/31/25)  UP/DOWN CAPTURE (01/01/21 - 12/31/25)                                                                                                 0.0%  15.0%  30.0%  45.0%
     150.0
 MSCI EAFE Value Index  MSCI EAFE Growth Index  125.0
 Capitalization  Up Capture     100.0
      75.0
      50.0
 MSCI EAFE Small Cap  MSCI Emerging Markets Index
         50.0      70.0       90.0      110.0      130.0     150.0
 Manager Style                  Down Capture
 Style History  Dec-2025  Average Style Exposure  Invesco Dev Mkt


 63
   366   367   368   369   370   371   372   373   374   375   376