
Page 30 - AugDefComp
P. 30
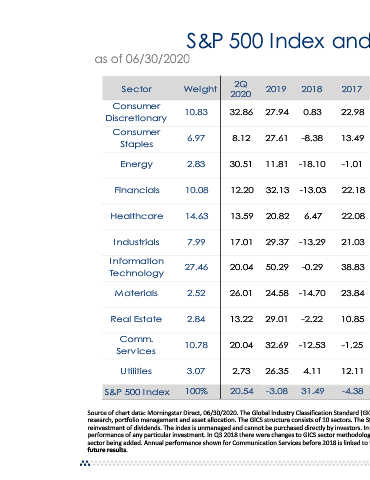
S&P 500 Index and Sector Returns (%)
                               2017  2010  2011  2012  2013  2014  2015  2016  27.66  6.13  23.92  43.08  9.68  10.11  6.03  22.98  14.11  13.99  10.76  26.14  15.98  6.60  5.38  13.49  20.46  4.72  4.61  25.07  -7.78  -21.12  27.36  -1.01  12.13  -17.06  28.82  35.63  15.20  -1.53  22.80  22.18  2.90  12.73  17.89  41.46  25.34  6.89  -2.69  22.08  26.73  -0.59  15.35  40.68  9.83  -2.53  18.86  21.03  10.19  2.41  14.82  28.43  20.12  5.92  13.85  38.83  22.20  -9.75  14.97  25.60  6.91  -8.38  16.69  23.84  32.32  11.39  19.74  1.60  30.19  4.68  3.39  10.85  18.97  6.27  18.31  11.47  2.99  3.40  23.49  -1.25  5.46  19.9


                               2018    0.83     -8.38   -18.10   -13.03  6.47     -13.29  -0.29    -14.70  -2.22    -12.53  4.11   31.49


                               2019    27.94    27.61   11.81    32.13   20.82    29.37   50.29    24.58   29.01    32.69   26.35  -3.08  Source of chart data: Morningstar Direct, 06/30/2020. The Global Industry Classification Standard (GICS) methodology has been


                             2Q   2020  32.86   8.12    30.51    12.20   13.59    17.01   20.04    26.01   13.22    20.04   2.73   20.54


                               Weight   10.83   6.97    2.83     10.08   14.63    7.99    27.46    2.52    2.84     10.78   3.07   100%


                      as of 06/30/2020  Sector  Consumer  Discretionary  Consumer  Staples  Energy  Financials  Healthcare  Industrials  Information   Technology  Materials  Real Estate  Comm.   Services  Utilities  S&P 500 Index  future results.