
Page 33 - AugDefComp
P. 33
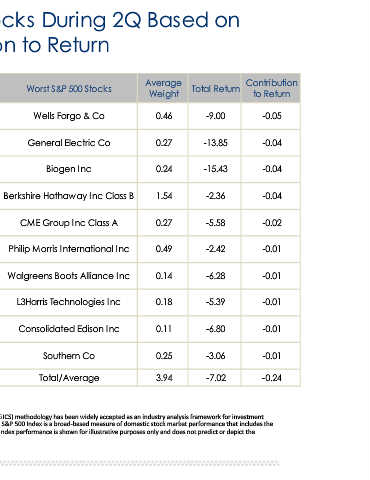
Contribution   to Return  -0.05  -0.04  -0.04  -0.04  -0.02  -0.01  -0.01  -0.01  -0.01   -0.01   -0.24


          Best & Worst S&P 500 Stocks During 2Q Based on
                               Total Return  -9.00  -13.85  -15.43  -2.36  -5.58    -2.42    -6.28    -5.39    -6.80   -3.06   -7.02


                             Average   Weight  0.46  0.27  0.24    1.54    0.27     0.49     0.14     0.18     0.11    0.25    3.94        widely accepted as an industry analysis framework for investment


                               Worst S&P 500 Stocks  Wells Fargo & Co  General Electric Co  Biogen Inc  Berkshire Hathaway Inc Class B  CME Group Inc Class A  Philip Morris International Inc  Walgreens Boots Alliance Inc  L3Harris Technologies Inc  Consolidated Edison Inc  Southern Co  Total/Average
                  Contribution to Return


                             Contribution   to Return  2.17  1.65  1.57  0.68  0.43  0.36    0.35     0.33     0.33    0.27    8.15           research, portfolio management and asset allocation. The GICS structure consists of 10 sectors. The S&P 500 Index is a broad‐based measure of domestic stock market performance that includes the  reinvestment of dividends. The index is unmanaged and cannot be purchased directly by investors. Index performance is shown for illustrative purposes only and does not predict or depict the


                               Total Return  43.84  29.40  41.50   36.13   81.98    22.04    21.57    44.19    34.97   36.79   39.24       Source of chart data: Morningstar Direct, 06/30/2020. The Global Industry Classification Standard (GICS) methodology has been


                             Average   Weight  5.10  5.61  4.03    2.02    0.61     1.67     1.66     0.78     1.01    0.72    23.22   The mention of specific companies does not constitute a recommendation. performance of any particular investment. Past performance does not guarantee future results.


                      as of 06/30/2020  Best S&P 500 Stocks  Apple Inc  Microsoft Corp  Amazon.com Inc  Facebook Inc A  PayPal Holdings Inc  Alphabet Inc A  Alphabet Inc Class C  NVIDIA Corp  The Home Depot Inc  Adobe Inc  Total/Average