
Page 31 - AugDefComp
P. 31
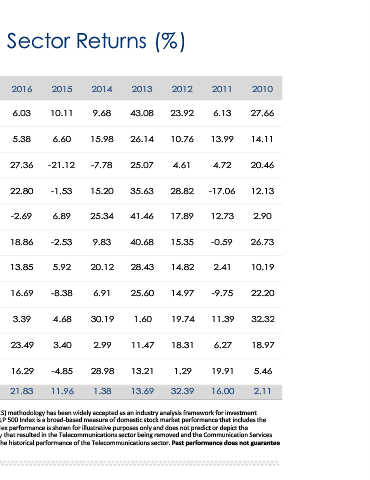
2010    27.66    14.11   20.46    12.13   2.90     26.73   10.19    22.20   32.32    18.97   5.46   2.11


                               2011    6.13     13.99   4.72     -17.06  12.73    -0.59   2.41     -9.75   11.39    6.27    19.91  16.00


                               2012    23.92    10.76   4.61     28.82   17.89    15.35   14.82    14.97   19.74    18.31   1.29   32.39  widely accepted as an industry analysis framework for investment
                 S&P 500 Index and Sector Returns (%)


                               2013    43.08    26.14   25.07    35.63   41.46    40.68   28.43    25.60   1.60     11.47   13.21  13.69


                               2014    9.68     15.98   -7.78    15.20   25.34    9.83    20.12    6.91    30.19    2.99    28.98  1.38


                               2015    10.11    6.60    -21.12   -1.53   6.89     -2.53   5.92     -8.38   4.68     3.40    -4.85  11.96


                               2016    6.03     5.38    27.36    22.80   -2.69    18.86   13.85    16.69   3.39     23.49   16.29  21.83


                               2017    22.98    13.49   -1.01    22.18   22.08    21.03   38.83    23.84   10.85    -1.25   12.11  -4.38    research, portfolio management and asset allocation. The GICS structure consists of 10 sectors. The S&P 500 Index is a broad‐based measure of domestic stock market performance that includes the  reinvestment of dividends. The index is unmanaged and cannot be purchased directly by investors. Index performance is shown for illustrative purposes only and does not predict or depict the  performance of any particular investment. In Q3 2018 there were changes to GICS sector methodology that re


                               2018    0.83     -8.38   -18.10   -13.03  6.47     -13.29  -0.29    -14.70  -2.22    -12.53  4.11   31.49


                               2019    27.94    27.61   11.81    32.13   20.82    29.37   50.29    24.58   29.01    32.69   26.35  -3.08  Source of chart data: Morningstar Direct, 06/30/2020. The Global Industry Classification Standard (GICS) methodology has been


                             2Q   2020  32.86   8.12    30.51    12.20   13.59    17.01   20.04    26.01   13.22    20.04   2.73   20.54


                               Weight   10.83   6.97    2.83     10.08   14.63    7.99    27.46    2.52    2.84     10.78   3.07   100%


                      as of 06/30/2020  Sector  Consumer  Discretionary  Consumer  Staples  Energy  Financials  Healthcare  Industrials  Information   Technology  Materials  Real Estate  Comm.   Services  Utilities  S&P 500 Index  future results.