
Page 138 - AugDefComp
P. 138
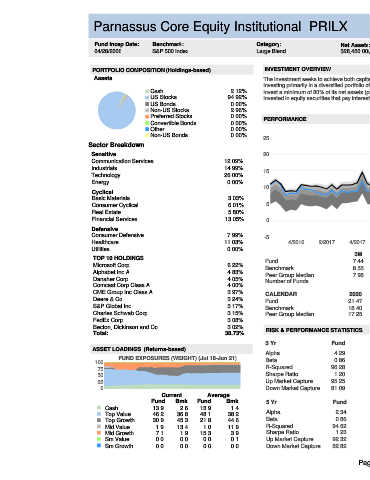
Parnassus Core Equity Institutional PRILX 6/30/2021
Fund Incep Date: Benchmark: Category: Net Assets: Manager Name: Manager Start Date: Expense Ratio: Expense Rank:
04/28/2006 S&P 500 Index Large Blend $28,450.00M Todd C. Ahlsten 05/01/2001 0.62% 37
PORTFOLIO COMPOSITION (Holdings-based) INVESTMENT OVERVIEW
Assets The investment seeks to achieve both capital appreciation and current income. The fund's objective is to achieve both capital appreciation and current income by
investing primarily in a diversified portfolio of equity securities. Equity securities include common and preferred stock. Under normal circumstances, the fund will
Cash 2.12% invest a minimum of 80% of its net assets (plus borrowings for investment purposes) in equity securities. At least 75% of the fund's total assets will normally be
US Stocks 94.92% invested in equity securities that pay interest or dividends.
US Bonds 0.00%
Non-US Stocks 2.96%
Preferred Stocks 0.00% PERFORMANCE
Convertible Bonds 0.00%
Other 0.00% 3 Year Rolling Performance (Jul 16-Jun 21)
Non-US Bonds 0.00% 25
Sector Breakdown 5th to 25th Percentile
25th to Median
Sensitive 20
Communication Services 12.09% Median to 75th Percentile
75th to 95th Percentile
Industrials 14.99%
15
Technology 26.00%
Parnassus Core
Energy 0.00%
10 Equity Institutional
Cyclical S&P 500 Index
Basic Materials 3.03%
Consumer Cyclical 6.01% 5
Real Estate 5.80%
Financial Services 13.05% 0
Defensive
Consumer Defensive 7.99% -5
Healthcare 11.03% 4/2016 2/2017 4/2017 2/2018 4/2018 2/2019 4/2019 2/2020 4/2020 2/2021
Utilities 0.00%
3M YTD 1Y 3Y 5Y 7Y 10Y SI
TOP 10 HOLDINGS
Fund 7.44 15.16 42.64 / 36 21.38 / 3 18.02 / 17 13.97 / 20 15.30 / 5 12.28
Microsoft Corp 6.22%
Benchmark 8.55 15.25 40.79 / 50 18.67 / 27 17.65 / 26 14.10 / 13 14.84 / 13
Alphabet Inc A 4.83% Peer Group Median 7.98 15.08 40.78 / 50 17.53 / 50 16.73 / 50 12.77 / 50 13.83 / 50
Danaher Corp 4.05%
Number of Funds 565 477 407 364 327
Comcast Corp Class A 4.00%
CME Group Inc Class A 3.97% CALENDAR 2020 2019 2018 2017 2016 2015 2014 2013 2012
Deere & Co 3.24% Fund 21.47 30.96 0.05 16.81 10.60 -0.33 14.70 34.15 15.64
S&P Global Inc 3.17% Benchmark 18.40 31.49 -4.38 21.83 11.96 1.38 13.69 32.39 16.00
Charles Schwab Corp 3.15% Peer Group Median 17.25 30.10 -5.50 21.23 11.15 -0.05 12.12 32.21 15.54
FedEx Corp 3.08%
Becton, Dickinson and Co 3.02%
RISK & PERFORMANCE STATISTICS NOTES
Total: 38.73%
Peer Group
3 Yr Fund Benchmark
ASSET LOADINGS (Returns-based) Median
Alpha 4.29 0.00 -0.92
FUND EXPOSURES (WEIGHT) (Jul 18-Jun 21) Beta 0.86 1.00 1.00
100
75 R-Squared 96.28 100.00 97.55
Sharpe Ratio 1.20 0.95 0.89
50
25 Up Market Capture 95.25 100.00 98.72
0 Down Market Capture 81.09 100.00 100.96
Current Average
Fund Bmk Fund Bmk 5 Yr Fund Benchmark Peer Group
Cash 13.9 2.6 13.9 1.4 Median
Top Value 46.2 36.8 48.1 38.2 Alpha 2.34 0.00 -0.71
Top Growth 30.9 45.3 21.8 44.6 Beta 0.86 1.00 1.00
Mid Value 1.9 13.4 1.0 11.9 R-Squared 94.62 100.00 96.93
Mid Growth 7.1 1.9 15.3 3.9 Sharpe Ratio 1.23 1.09 1.02
Sm Value 0.0 0.0 0.0 0.1 Up Market Capture 92.32 100.00 98.56
Sm Growth 0.0 0.0 0.0 0.0 Down Market Capture 82.82 100.00 100.91
Page 63