
Page 142 - AugDefComp
P. 142
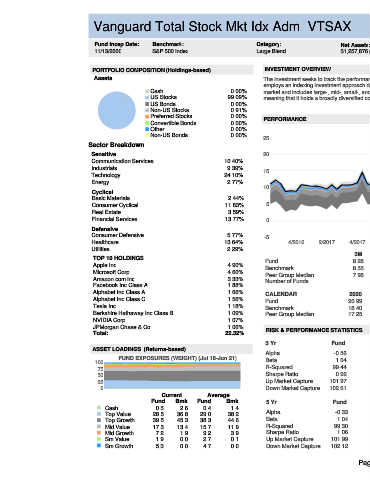
Vanguard Total Stock Mkt Idx Adm VTSAX 6/30/2021
Fund Incep Date: Benchmark: Category: Net Assets: Manager Name: Manager Start Date: Expense Ratio: Expense Rank:
11/13/2000 S&P 500 Index Large Blend $1,257,876.00M Gerard C. O'Reilly 12/31/1994 0.04% 3
PORTFOLIO COMPOSITION (Holdings-based) INVESTMENT OVERVIEW
Assets The investment seeks to track the performance of the CRSP US Total Market Index that measures the investment return of the overall stock market. The fund
employs an indexing investment approach designed to track the performance of the index, which represents approximately 100% of the investable U.S. stock
Cash 0.00% market and includes large-, mid-, small-, and micro-cap stocks regularly traded on the New York Stock Exchange and Nasdaq. It invests by sampling the index,
US Stocks 99.09% meaning that it holds a broadly diversified collection of securities that, in the aggregate, approximates the full index in terms of key characteristics.
US Bonds 0.00%
Non-US Stocks 0.91%
Preferred Stocks 0.00% PERFORMANCE
Convertible Bonds 0.00%
Other 0.00% 3 Year Rolling Performance (Jul 16-Jun 21)
Non-US Bonds 0.00% 25
Sector Breakdown 5th to 25th Percentile
25th to Median
Sensitive 20
Communication Services 10.40% Median to 75th Percentile
75th to 95th Percentile
Industrials 9.39%
15
Technology 24.10%
Vanguard Total
Energy 2.77%
10 Stock Mkt Idx Adm
Cyclical S&P 500 Index
Basic Materials 2.44%
Consumer Cyclical 11.83% 5
Real Estate 3.59%
Financial Services 13.77% 0
Defensive
Consumer Defensive 5.77% -5
Healthcare 13.64% 4/2016 2/2017 4/2017 2/2018 4/2018 2/2019 4/2019 2/2020 4/2020 2/2021
Utilities 2.29%
3M YTD 1Y 3Y 5Y 7Y 10Y SI
TOP 10 HOLDINGS
Fund 8.28 15.24 44.33 / 21 18.75 / 24 17.90 / 19 13.94 / 20 14.70 / 20 8.37
Apple Inc 4.90%
Benchmark 8.55 15.25 40.79 / 50 18.67 / 27 17.65 / 26 14.10 / 13 14.84 / 13
Microsoft Corp 4.60% Peer Group Median 7.98 15.08 40.78 / 50 17.53 / 50 16.73 / 50 12.77 / 50 13.83 / 50
Amazon.com Inc 3.33%
Number of Funds 565 477 407 364 327
Facebook Inc Class A 1.88%
Alphabet Inc Class A 1.66% CALENDAR 2020 2019 2018 2017 2016 2015 2014 2013 2012
Alphabet Inc Class C 1.56% Fund 20.99 30.80 -5.17 21.17 12.66 0.39 12.56 33.52 16.38
Tesla Inc 1.18% Benchmark 18.40 31.49 -4.38 21.83 11.96 1.38 13.69 32.39 16.00
Berkshire Hathaway Inc Class B 1.09% Peer Group Median 17.25 30.10 -5.50 21.23 11.15 -0.05 12.12 32.21 15.54
NVIDIA Corp 1.07%
JPMorgan Chase & Co 1.06%
RISK & PERFORMANCE STATISTICS NOTES
Total: 22.32%
Peer Group
3 Yr Fund Benchmark
ASSET LOADINGS (Returns-based) Median
Alpha -0.56 0.00 -0.92
FUND EXPOSURES (WEIGHT) (Jul 18-Jun 21) Beta 1.04 1.00 1.00
100
75 R-Squared 99.44 100.00 97.55
Sharpe Ratio 0.92 0.95 0.89
50
25 Up Market Capture 101.97 100.00 98.72
0 Down Market Capture 102.61 100.00 100.96
Current Average
Fund Bmk Fund Bmk 5 Yr Fund Benchmark Peer Group
Cash 0.5 2.6 0.4 1.4 Median
Top Value 28.5 36.8 29.0 38.2 Alpha -0.33 0.00 -0.71
Top Growth 39.5 45.3 38.3 44.6 Beta 1.04 1.00 1.00
Mid Value 17.3 13.4 15.7 11.9 R-Squared 99.30 100.00 96.93
Mid Growth 7.2 1.9 9.2 3.9 Sharpe Ratio 1.06 1.09 1.02
Sm Value 1.9 0.0 2.7 0.1 Up Market Capture 101.99 100.00 98.56
Sm Growth 5.3 0.0 4.7 0.0 Down Market Capture 102.12 100.00 100.91
Page 65