
Page 141 - AugDefComp
P. 141
Vanguard Institutional Index I VINIX 6/30/2021
Fund Incep Date: Benchmark: Category: Net Assets: Manager Name: Manager Start Date: Expense Ratio: Expense Rank:
07/31/1990 S&P 500 Index Large Blend $287,782.00M Donald M. Butler 12/31/2000 0.04% 3
PORTFOLIO COMPOSITION (Holdings-based) INVESTMENT OVERVIEW
Assets The investment seeks to track the performance of the S&P 500 Index that measures the investment return of large-capitalization stocks. The fund employs an
indexing investment approach designed to track the performance of the S&P 500 Index, a widely recognized benchmark of U.S. stock market performance that is
Cash 0.02% dominated by the stocks of large U.S. companies. The advisor attempts to replicate the target index by investing all, or substantially all, of its assets in the stocks
US Stocks 98.97% that make up the index, holding each stock in approximately the same proportion as its weighting in the index.
US Bonds 0.00%
Non-US Stocks 1.01%
Preferred Stocks 0.00% PERFORMANCE
Convertible Bonds 0.00%
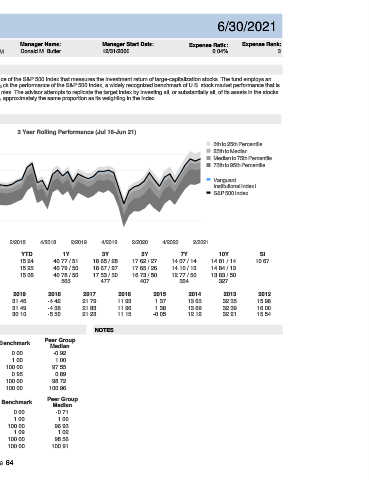
Other 0.00% 3 Year Rolling Performance (Jul 16-Jun 21)
Non-US Bonds 0.00% 25
Sector Breakdown 5th to 25th Percentile
25th to Median
Sensitive 20
Communication Services 11.15% Median to 75th Percentile
75th to 95th Percentile
Industrials 8.86%
15
Technology 24.24%
Vanguard
Energy 2.84%
10 Institutional Index I
Cyclical S&P 500 Index
Basic Materials 2.27%
Consumer Cyclical 12.01% 5
Real Estate 2.58%
Financial Services 14.21% 0
Defensive
Consumer Defensive 6.30% -5
Healthcare 13.10% 4/2016 2/2017 4/2017 2/2018 4/2018 2/2019 4/2019 2/2020 4/2020 2/2021
Utilities 2.44%
3M YTD 1Y 3Y 5Y 7Y 10Y SI
TOP 10 HOLDINGS
Fund 8.54 15.24 40.77 / 51 18.65 / 28 17.62 / 27 14.07 / 14 14.81 / 14 10.67
Apple Inc 5.92%
Benchmark 8.55 15.25 40.79 / 50 18.67 / 27 17.65 / 26 14.10 / 13 14.84 / 13
Microsoft Corp 5.62% Peer Group Median 7.98 15.08 40.78 / 50 17.53 / 50 16.73 / 50 12.77 / 50 13.83 / 50
Amazon.com Inc 4.06%
Number of Funds 565 477 407 364 327
Facebook Inc Class A 2.29%
Alphabet Inc Class A 2.02% CALENDAR 2020 2019 2018 2017 2016 2015 2014 2013 2012
Alphabet Inc Class C 1.97% Fund 18.39 31.46 -4.42 21.79 11.93 1.37 13.65 32.35 15.98
Berkshire Hathaway Inc Class B 1.45% Benchmark 18.40 31.49 -4.38 21.83 11.96 1.38 13.69 32.39 16.00
Tesla Inc 1.44% Peer Group Median 17.25 30.10 -5.50 21.23 11.15 -0.05 12.12 32.21 15.54
NVIDIA Corp 1.37%
JPMorgan Chase & Co 1.30%
RISK & PERFORMANCE STATISTICS NOTES
Total: 27.44%
Peer Group
3 Yr Fund Benchmark
ASSET LOADINGS (Returns-based) Median
Alpha -0.02 0.00 -0.92
FUND EXPOSURES (WEIGHT) (Jul 18-Jun 21) Beta 1.00 1.00 1.00
100
75 R-Squared 100.00 100.00 97.55
Sharpe Ratio 0.95 0.95 0.89
50
25 Up Market Capture 99.96 100.00 98.72
0 Down Market Capture 100.03 100.00 100.96
Current Average
Fund Bmk Fund Bmk 5 Yr Fund Benchmark Peer Group
Cash 2.6 2.6 1.3 1.4 Median
Top Value 36.8 36.8 38.2 38.2 Alpha -0.02 0.00 -0.71
Top Growth 45.3 45.3 44.6 44.6 Beta 1.00 1.00 1.00
Mid Value 13.4 13.4 11.9 11.9 R-Squared 100.00 100.00 96.93
Mid Growth 1.9 1.9 3.9 3.9 Sharpe Ratio 1.09 1.09 1.02
Sm Value 0.0 0.0 0.1 0.1 Up Market Capture 99.93 100.00 98.56
Sm Growth 0.0 0.0 0.0 0.0 Down Market Capture 100.04 100.00 100.91
Page 64