
Page 167 - AugDefComp
P. 167
Vanguard Utilities Index Adm VUIAX 6/30/2021
Fund Incep Date: Benchmark: Category: Net Assets: Manager Name: Manager Start Date: Expense Ratio: Expense Rank:
04/28/2004 DJ Americas Utilities Utilities $6,121.00M Michael A. Johnson 08/31/2015 0.10% 3
PORTFOLIO COMPOSITION (Holdings-based) INVESTMENT OVERVIEW
Assets The investment seeks to track the performance of a benchmark index. The fund employs an indexing investment approach designed to track the performance of
the MSCI US Investable Market Index (IMI)/Utilities 25/50, an index made up of stocks of large, mid-size, and small U.S. companies within the utilities sector, as
Cash 0.07% classified under the Global Industry Classification Standard (GICS). The Advisor attempts to replicate the target index by seeking to invest all, or substantially all,
US Stocks 99.93% of its assets in the stocks that make up the index, in order to hold each stock in approximately the same proportion as its weighting in the index. The fund is
US Bonds 0.00% non-diversified.
Non-US Stocks 0.00%
Preferred Stocks 0.00% PERFORMANCE
Convertible Bonds 0.00%
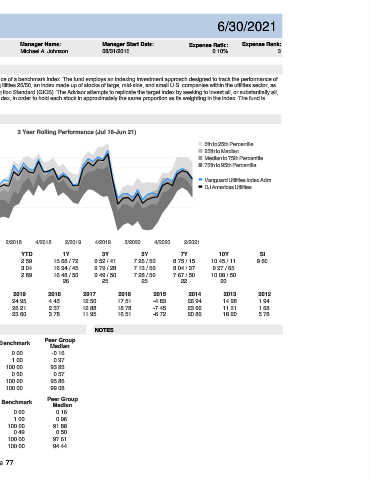
Other 0.00% 3 Year Rolling Performance (Jul 16-Jun 21)
Non-US Bonds 0.00% 18
Sector Breakdown 5th to 25th Percentile
16 25th to Median
Sensitive 14
Communication Services 0.00% Median to 75th Percentile
Industrials 0.00% 12 75th to 95th Percentile
Technology 0.30%
10 Vanguard Utilities Index Adm
Energy 0.44%
8 DJ Americas Utilities
Cyclical
Basic Materials 0.61% 6
Consumer Cyclical 0.00% 4
Real Estate 0.00%
Financial Services 0.00% 2
Defensive 0
Consumer Defensive 0.00% -2
Healthcare 0.00% 4/2016 2/2017 4/2017 2/2018 4/2018 2/2019 4/2019 2/2020 4/2020 2/2021
Utilities 98.66%
3M YTD 1Y 3Y 5Y 7Y 10Y SI
TOP 10 HOLDINGS
Fund -0.39 2.59 15.68 / 72 9.52 / 41 7.26 / 53 8.75 / 15 10.45 / 11 9.80
NextEra Energy Inc 13.88%
Benchmark 0.18 3.04 16.94 / 45 9.79 / 28 7.13 / 56 8.04 / 37 9.27 / 65
Duke Energy Corp 7.33% Peer Group Median 0.29 2.89 16.48 / 50 9.49 / 50 7.28 / 50 7.67 / 50 10.08 / 50
Southern Co 6.18%
Number of Funds 26 25 25 22 20
Dominion Energy Inc 5.73%
Exelon Corp 4.18% CALENDAR 2020 2019 2018 2017 2016 2015 2014 2013 2012
American Electric Power Co Inc 4.06% Fund -0.81 24.95 4.45 12.50 17.51 -4.83 26.94 14.98 1.94
Sempra Energy 3.88% Benchmark -1.32 26.21 2.37 12.88 18.78 -7.45 23.66 11.51 1.68
Xcel Energy Inc 3.42% Peer Group Median -0.01 23.60 3.78 11.95 16.51 -6.72 20.86 18.20 5.78
Public Service Enterprise Group Inc 2.92%
WEC Energy Group Inc 2.71%
RISK & PERFORMANCE STATISTICS NOTES
Total: 54.30%
Peer Group
3 Yr Fund Benchmark
ASSET LOADINGS (Returns-based) Median
Alpha -0.02 0.00 -0.16
FUND EXPOSURES (WEIGHT) (Jul 18-Jun 21) Beta 0.97 1.00 0.97
100
75 R-Squared 98.15 100.00 93.83
Sharpe Ratio 0.60 0.60 0.57
50
25 Up Market Capture 98.87 100.00 95.86
0 Down Market Capture 99.96 100.00 99.08
Current Average
Fund Bmk Fund Bmk 5 Yr Fund Benchmark Peer Group
Cash 23.9 6.6 9.6 3.5 Median
US Bonds 35.8 45.5 51.3 51.4 Alpha 0.17 0.00 0.16
US Equity 40.3 47.9 33.7 35.5 Beta 0.99 1.00 0.96
Int'l Equity 0.0 0.0 5.4 9.6 R-Squared 97.92 100.00 91.88
Sharpe Ratio 0.50 0.49 0.50
Up Market Capture 102.79 100.00 97.61
Down Market Capture 102.58 100.00 94.44
Page 77