Page 162 - AugDefComp
P. 162

Hartford Healthcare HLS IA                              HIAHX                                                                                                      6/30/2021


                                Fund Incep Date:      Benchmark:                     Category:                   Net Assets:      Manager Name:              Manager Start Date:          Expense Ratio:   Expense Rank:
                                05/01/2000         DJ Americas Health Care           Health                      $215.00M         Robert L. Deresiewicz      05/01/2000                          0.91%                67


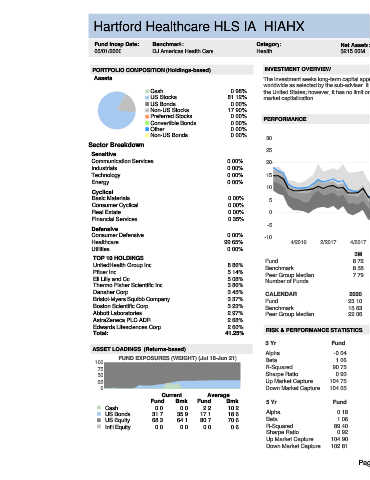
                               PORTFOLIO COMPOSITION (Holdings-based)                   INVESTMENT OVERVIEW
                                Assets                                                  The investment seeks long-term capital appreciation. The fund invests at least 80% of its assets in the equity securities of health care-related companies
                                                                                        worldwide as selected by the sub-adviser. It will invest in securities of issuers located in a number of different countries throughout the world, one of which may be
                                                  Cash                       0.98%       the United States; however, it has no limit on the amount of assets that may be invested in each country. The fund may invest in securities of companies of any
                                                  US Stocks                 81.12%       market capitalization.
                                                  US Bonds                   0.00%
                                                  Non-US Stocks             17.90%
                                                  Preferred Stocks           0.00%       PERFORMANCE
                                                  Convertible Bonds          0.00%
                                                  Other                      0.00%                                               3 Year Rolling Performance (Jul 16-Jun 21)
                                                  Non-US Bonds               0.00%       30
                              Sector Breakdown                                                                                                                                                  5th to 25th Percentile
                                                                                         25                                                                                                     25th to Median
                               Sensitive
                               Communication Services                       0.00%        20                                                                                                     Median to 75th Percentile
                               Industrials                                  0.00%                                                                                                               75th to 95th Percentile
                               Technology                                   0.00%        15
                                                                                                                                                                                                Hartford Healthcare HLS IA
                               Energy                                       0.00%
                                                                                         10                                                                                                     DJ Americas Health Care
                               Cyclical
                               Basic Materials                              0.00%         5
                               Consumer Cyclical                            0.00%
                               Real Estate                                  0.00%         0
                               Financial Services                           0.35%
                                                                                         -5
                               Defensive
                               Consumer Defensive                           0.00%       -10
                               Healthcare                                  99.65%                4/2016    2/2017    4/2017   2/2018    4/2018    2/2019    4/2019    2/2020    4/2020   2/2021
                               Utilities                                    0.00%
                                                                                                                      3M          YTD           1Y           3Y           5Y           7Y          10Y           SI
                               TOP 10 HOLDINGS
                                                                                        Fund                         8.72         8.12       27.09 / 47   17.99 / 24   15.74 / 39   13.94 / 31   16.75 / 28    13.11
                               UnitedHealth Group Inc                       8.86%
                                                                                        Benchmark                    8.58         11.94      28.83 / 42   17.30 / 36   14.87 / 53   13.12 / 46   15.85 / 42
                               Pfizer Inc                                   5.14%       Peer Group Median            7.79         8.90       26.32 / 50   16.26 / 50   14.99 / 50   12.66 / 50   15.52 / 50
                               Eli Lilly and Co                             5.08%
                                                                                        Number of Funds                                         74           66           61           54           48
                               Thermo Fisher Scientific Inc                 3.86%
                               Danaher Corp                                 3.45%       CALENDAR                    2020       2019        2018        2017       2016        2015       2014        2013       2012
                               Bristol-Myers Squibb Company                 3.37%       Fund                        23.10      33.95       -2.67      22.26        -8.39     13.21       27.39       51.84      20.62
                               Boston Scientific Corp                       3.23%       Benchmark                   15.63      21.22        5.94      23.00        -3.34      5.85       25.49       42.03      19.34
                               Abbott Laboratories                          2.97%       Peer Group Median           22.06      24.75        0.59      22.61       -10.16      7.72       26.82       43.64      18.73
                               AstraZeneca PLC ADR                          2.68%
                               Edwards Lifesciences Corp                    2.60%
                                                                                         RISK & PERFORMANCE STATISTICS                                     NOTES
                               Total:                                      41.25%
                                                                                                                                          Peer Group
                                                                                        3 Yr                  Fund         Benchmark
                               ASSET LOADINGS  (Returns-based)                                                                              Median
                                                                                        Alpha                  -0.04           0.00          -0.94
                                        FUND EXPOSURES (WEIGHT) (Jul 18-Jun 21)         Beta                    1.06           1.00           1.05
                                100
                                 75                                                     R-Squared              90.75         100.00         83.71
                                                                                        Sharpe Ratio            0.93           0.98           0.84
                                 50
                                 25                                                     Up Market Capture     104.75         100.00        100.61
                                  0                                                     Down Market Capture   104.05         100.00        104.21
                                                      Current        Average
                                                  Fund     Bmk    Fund     Bmk           5 Yr                  Fund         Benchmark      Peer Group
                                   Cash             0.0     0.0     2.2     10.2                                                             Median
                                   US Bonds        31.7    35.9    17.1     18.6         Alpha                  0.18            0.00          -0.51
                                   US Equity       68.3    64.1    80.7     70.6         Beta                   1.06            1.00          1.06
                                   Int'l Equity     0.0     0.0     0.0      0.6         R-Squared             89.40          100.00         80.61
                                                                                         Sharpe Ratio           0.92            0.96          0.86
                                                                                         Up Market Capture    104.90          100.00        103.87
                                                                                         Down Market Capture  102.81          100.00        102.82

                                                                                                                       Page 75
   157   158   159   160   161   162   163   164   165   166   167