Page 164 - AugDefComp
P. 164

Invesco Real Estate R5                          IARIX                                                                                                              6/30/2021


                                Fund Incep Date:      Benchmark:                     Category:                   Net Assets:      Manager Name:              Manager Start Date:          Expense Ratio:   Expense Rank:
                                04/30/2004         MSCI US REIT                      Real Estate                 $2,063.00M       Joe V. Rodriguez           05/01/1995                          0.87%                51


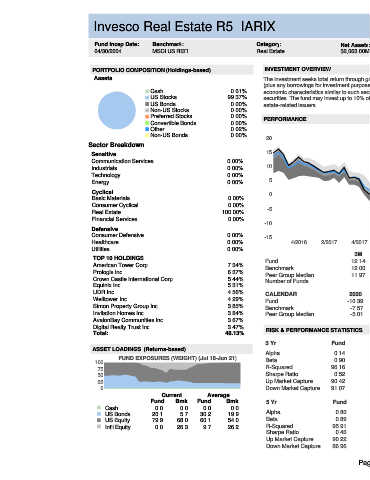
                               PORTFOLIO COMPOSITION (Holdings-based)                   INVESTMENT OVERVIEW
                                Assets                                                  The investment seeks total return through growth of capital and current income. The fund invests, under normal circumstances, at least 80% of its net assets
                                                                                        (plus any borrowings for investment purposes) in securities of real estate and real estate-related issuers, and in derivatives and other instruments that have
                                                  Cash                       0.61%       economic characteristics similar to such securities. It may also invest in debt securities, including corporate debt obligations and commercial mortgage-backed
                                                  US Stocks                 99.37%       securities. The fund may invest up to 10% of its net assets in non-investment grade debt securities (commonly known as "junk bonds") of real estate and real
                                                  US Bonds                   0.00%       estate-related issuers.
                                                  Non-US Stocks              0.00%
                                                  Preferred Stocks           0.00%       PERFORMANCE
                                                  Convertible Bonds          0.00%
                                                  Other                      0.02%                                               3 Year Rolling Performance (Jul 16-Jun 21)
                                                  Non-US Bonds               0.00%       20
                              Sector Breakdown                                                                                                                                                    5th to 25th Percentile
                               Sensitive                                                 15                                                                                                       25th to Median
                               Communication Services                       0.00%                                                                                                                 Median to 75th Percentile
                               Industrials                                  0.00%        10                                                                                                       75th to 95th Percentile
                               Technology                                   0.00%
                               Energy                                       0.00%         5                                                                                                       Invesco Real Estate R5
                                                                                                                                                                                                  MSCI US REIT
                               Cyclical
                                                                                          0
                               Basic Materials                              0.00%
                               Consumer Cyclical                            0.00%
                                                                                         -5
                               Real Estate                                100.00%
                               Financial Services                           0.00%
                                                                                        -10
                               Defensive
                               Consumer Defensive                           0.00%       -15
                               Healthcare                                   0.00%                4/2016    2/2017    4/2017    2/2018    4/2018    2/2019    4/2019    2/2020    4/2020    2/2021
                               Utilities                                    0.00%
                                                                                                                      3M          YTD           1Y           3Y           5Y           7Y          10Y           SI
                               TOP 10 HOLDINGS
                                                                                        Fund                         12.14        21.69      27.38 / 97   9.49 / 74    6.69 / 59    8.11 / 63    9.00 / 64      9.85
                               American Tower Corp                          7.34%
                                                                                        Benchmark                    12.00        21.80      38.05 / 35   10.14 / 64   6.32 / 70    8.34 / 56    9.38 / 45
                               Prologis Inc                                 6.37%       Peer Group Median            11.97        21.26      36.08 / 50   11.28 / 50   7.06 / 50    8.49 / 50    9.19 / 50
                               Crown Castle International Corp              5.44%
                                                                                        Number of Funds                                         87           84           74           66           58
                               Equinix Inc                                  5.31%
                               UDR Inc                                      4.56%       CALENDAR                    2020       2019        2018        2017       2016        2015       2014        2013       2012
                               Welltower Inc                                4.29%       Fund                       -10.39      28.22       -5.28       8.86       6.18        2.07       28.62       2.18       16.99
                               Simon Property Group Inc                     3.85%       Benchmark                   -7.57      25.84       -4.57       5.07       8.60        2.52       30.38       2.47       17.77
                               Invitation Homes Inc                         3.84%       Peer Group Median           -5.01      26.86       -5.14       5.44       6.79        2.77       29.83       1.87       17.21
                               AvalonBay Communities Inc                    3.67%
                               Digital Realty Trust Inc                     3.47%
                                                                                         RISK & PERFORMANCE STATISTICS                                     NOTES
                               Total:                                      48.13%
                                                                                                                                          Peer Group
                                                                                        3 Yr                  Fund         Benchmark
                               ASSET LOADINGS  (Returns-based)                                                                              Median
                                                                                        Alpha                  0.14            0.00          1.59
                                        FUND EXPOSURES (WEIGHT) (Jul 18-Jun 21)         Beta                   0.90            1.00          0.92
                                100
                                 75                                                     R-Squared             96.16          100.00         96.65
                                                                                        Sharpe Ratio           0.52            0.53          0.61
                                 50
                                 25                                                     Up Market Capture     90.42          100.00         97.29
                                  0                                                     Down Market Capture   91.07          100.00         91.11
                                                      Current        Average
                                                  Fund     Bmk    Fund     Bmk           5 Yr                  Fund         Benchmark      Peer Group
                                   Cash             0.0     0.0     0.0      0.0                                                             Median
                                   US Bonds        20.1     5.7    30.2     19.9         Alpha                  0.80            0.00          0.95
                                   US Equity       79.9    68.0    60.1     54.0         Beta                   0.89            1.00          0.92
                                   Int'l Equity     0.0    26.3     9.7     26.2         R-Squared             95.91          100.00         96.44
                                                                                         Sharpe Ratio           0.43            0.38          0.43
                                                                                         Up Market Capture     90.22          100.00         95.93
                                                                                         Down Market Capture   86.96          100.00         91.83

                                                                                                                       Page 76
   159   160   161   162   163   164   165   166   167   168   169