
Page 18 - AugDefComp
P. 18
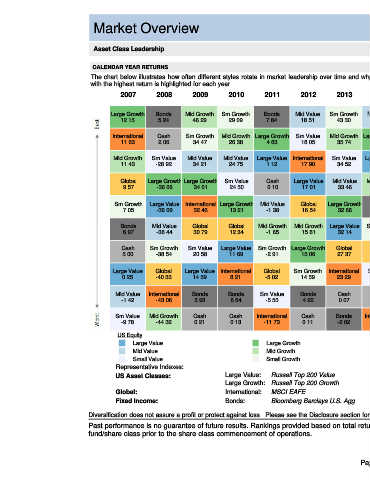
Market Overview                                                                                                                                                   6/30/2021


                                Asset Class Leadership


                               CALENDAR YEAR RETURNS
                               The chart below illustrates how often different styles rotate in market leadership over time and why style diversification may help to minimize overall portfolio volatility.   In the chart below, the style
                               with the highest return is highlighted for each year.
                                         2007        2008       2009        2010        2011        2012        2013        2014        2015        2016        2017        2018       2019        2020        YTD


                                     Large Growth   Bonds     Mid Growth  Sm Growth     Bonds     Mid Value   Sm Growth   Mid Value  Large Growth  Sm Value  Large Growth   Cash    Large Growth International  Sm Value
                                         12.15       5.24        46.29      29.09        7.84       18.51       43.30       14.75       8.18        31.74       31.92       1.87        36.48       8.28       26.69


                                      International  Cash     Sm Growth   Mid Growth Large Growth  Sm Value   Mid Growth Large Growth   Bonds     Mid Value  International  Bonds    Mid Growth    Bonds      Mid Value
                                         11.63       2.06        34.47      26.38        4.63       18.05       35.74       13.57       0.55        20.00       25.62       0.01        35.47       7.51       19.45

                                      Mid Growth   Sm Value    Mid Value   Mid Value  Large Value International  Sm Value  Large Value  Cash     Large Value  Mid Growth Large Growth Sm Growth   Mid Value  Large Value
                                         11.43      -28.92       34.21      24.75        1.12       17.90       34.52       12.94       0.05        16.20       25.27       -0.52       28.48       4.96       15.76

                                        Global   Large Growth Large Growth  Sm Value     Cash     Large Value  Mid Value  Mid Growth  Mid Growth  Sm Growth    Global    Mid Growth    Global     Sm Value  Large Growth
                                         9.57       -36.06       34.01      24.50        0.10       17.01       33.46       11.90       -0.20       11.32       23.07       -4.75       28.40       4.63       13.59


                                      Sm Growth   Large Value International Large Growth  Mid Value  Global  Large Growth   Bonds       Global     Global    Sm Growth   Large Value  Mid Value  Large Growth  Global
                                         7.05       -36.09       32.46      13.21        -1.38      16.54       32.66        5.97       -0.32       8.15        22.17       -6.22       27.06      39.34       13.33

                                        Bonds      Mid Value    Global      Global    Mid Growth  Mid Growth  Large Value  Sm Growth  International  Mid Growth  Large Value  Global  Large Value  Mid Growth  Mid Growth
                                         6.97       -38.44       30.79      12.34        -1.65      15.81       32.14        5.60       -0.39       7.33        13.83       -8.20       26.36      35.59       10.44

                                         Cash     Sm Growth    Sm Value   Large Value  Sm Growth Large Growth   Global      Global    Sm Growth Large Growth  Mid Value  Sm Growth   International  Sm Growth  International
                                         5.00       -38.54       20.58      11.69        -2.91      15.06       27.37        5.50       -1.38       6.95        13.34       -9.31       22.66      34.63        9.17


                                      Large Value   Global    Large Value International  Global   Sm Growth  International  Sm Value  Large Value   Bonds     Sm Value    Mid Value   Sm Value     Global    Sm Growth
                                         0.25       -40.33       14.59       8.21        -5.02      14.59       23.29        4.22       -3.41       2.65        7.84       -12.29       22.39      16.50        8.98

                                       Mid Value  International  Bonds      Bonds      Sm Value     Bonds       Cash        Cash      Mid Value  International  Bonds     Sm Value     Bonds     Large Value    Cash
                                         -1.42      -43.06       5.93        6.54        -5.50       4.22        0.07        0.03       -4.78       1.51        3.54       -12.86       8.72        1.64        0.02


                                       Sm Value   Mid Growth     Cash        Cash     International  Cash       Bonds    International  Sm Value    Cash        Cash     International  Cash        Cash       Bonds
                                         -9.78      -44.32       0.21        0.13       -11.73       0.11       -2.02       -4.48       -7.47       0.33        0.86       -13.36       2.28        0.67        -1.60

                                        US Equity                                                                               Fixed Income                                Global Equity
                                             Large Value                                 Large Growth                                Bonds                                       International
                                             Mid Value                                   Mid Growth                                  Cash                                        Global
                                             Small Value                                 Small Growth
                                       Representative Indexes:
                                       US Asset Classes:                   Large Value:    Russell Top 200 Value           Mid Value:     Russell Mid-Cap Value           Sm Value:       Russell 2000 Value
                                                                           Large Growth:   Russell Top 200 Growth          Mid Growth:    Russell Mid-Cap Growth          Sm Growth:      Russell 2000 Growth
                                       Global:                             International:   MSCI EAFE                      Global:        MSCI The World
                                       Fixed Income:                       Bonds:         Bloomberg Barclays U.S. Agg      Cash:          Merrill Lynch 3-Mo T-Bill

                              Diversification does not assure a profit or protect against loss.  Please see the Disclosure section for definition of all indices discussed.
                              Past performance is no guarantee of future results. Rankings provided based on total returns. Performance quoted for mutual funds may include performance of a predecessor
                              fund/share class prior to the share class commencement of operations.


                                                                                                                        Page 3