
Page 20 - AugDefComp
P. 20
Market Overview 6/30/2021
Financial Market Snapshot
U.S. EQUITY RISK/RETURN (3-Year)
30
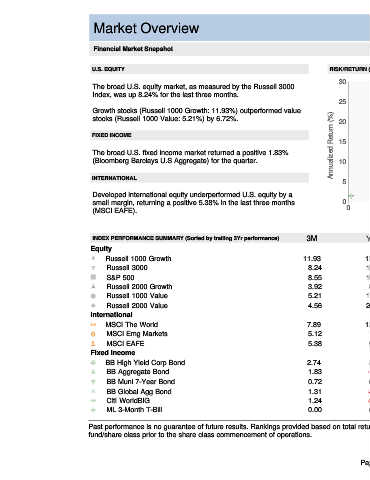
The broad U.S. equity market, as measured by the Russell 3000
Index, was up 8.24% for the last three months.
25
Growth stocks (Russell 1000 Growth: 11.93%) outperformed value
Annualized Return (%) 15
stocks (Russell 1000 Value: 5.21%) by 6.72%. 20
FIXED INCOME
The broad U.S. fixed income market returned a positive 1.83%
(Bloomberg Barclays U.S Aggregate) for the quarter. 10
INTERNATIONAL
5
Developed international equity underperformed U.S. equity by a
small margin, returning a positive 5.38% in the last three months 0
(MSCI EAFE). 0 5 10 15 20 25 30
Annualized Standard Deviation (%)
INDEX PERFORMANCE SUMMARY (Sorted by trailing 3Yr performance) 3M YTD 1 Year 3 Years 5 Years 10 Years
Equity
Russell 1000 Growth 11.93 12.99 42.50 25.14 23.66 17.87
Russell 3000 8.24 15.11 44.16 18.73 17.89 14.70
S&P 500 8.55 15.25 40.79 18.67 17.65 14.84
Russell 2000 Growth 3.92 8.98 51.36 15.94 18.76 13.52
Russell 1000 Value 5.21 17.05 43.68 12.42 11.87 11.61
Russell 2000 Value 4.56 26.69 73.28 10.27 13.62 10.85
International
MSCI The World 7.89 13.33 39.67 15.59 15.44 11.26
MSCI Emg Markets 5.12 7.58 41.36 11.67 13.43 4.65
MSCI EAFE 5.38 9.17 32.92 8.77 10.79 6.38
Fixed Income
BB High Yield Corp Bond 2.74 3.62 15.37 7.45 7.48 6.66
BB Aggregate Bond 1.83 -1.60 -0.33 5.34 3.03 3.39
BB Muni 7-Year Bond 0.72 0.18 2.95 4.63 2.85 3.59
BB Global Agg Bond 1.31 -3.21 2.63 4.23 2.34 2.05
Citi WorldBIG 1.24 -3.51 1.95 4.20 2.40 2.09
ML 3-Month T-Bill 0.00 0.02 0.09 1.34 1.17 0.63
Past performance is no guarantee of future results. Rankings provided based on total returns. Performance quoted for mutual funds may include performance of a predecessor
fund/share class prior to the share class commencement of operations.
Page 4