Page 26 - AugDefComp
P. 26

Market Overview                                                                                                                                                   6/30/2021


                                International Snapshot


                                INTERNATIONAL
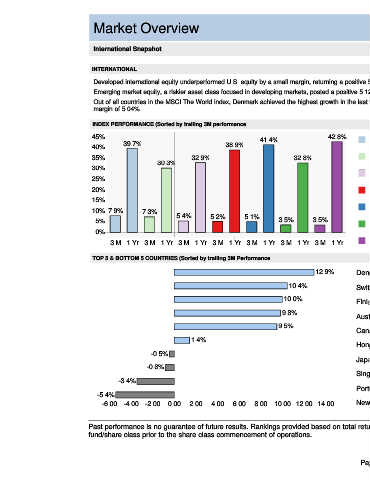
                                Developed international equity underperformed U.S. equity by a small margin, returning a positive 5.38% in the last three months (MSCI EAFE).
                                Emerging market equity, a riskier asset class focused in developing markets, posted a positive 5.12% return, as measured by the MSCI Emerging Markets Free Index.
                                Out of all countries in the MSCI The World index, Denmark achieved the highest growth in the last three months, returning a positive  12.93% return, outperforming the MSCI The World Index by a
                                margin of 5.04%.

                               INDEX PERFORMANCE (Sorted by trailing 3M performance)                                                                           3 M       YTD       1 Yr      3 Yr      5 Yr      10 Yr

                               45%                                                                           42.8%
                                          39.7%                                        41.4%                               MSCI The World                      7.89     13.33     39.67     15.59      15.44     11.26
                               40%                                         38.9%
                               35%                              32.9%                             32.8%                    MSCI EAFE Large Growth              7.33       6.95    30.34     13.40      12.81      7.86
                                                     30.3%
                               30%
                                                                                                                           MSCI EAFE                           5.38       9.17    32.92       8.77     10.79      6.38
                               25%
                               20%                                                                                         MSCI EAFE Small Growth              5.19       6.74    38.88     10.74      13.71      9.53
                               15%
                                                                                                                           MSCI Emg Markets                    5.12       7.58    41.36     11.67      13.43      4.65
                               10% 7.9%         7.3%
                                                           5.4%       5.2%        5.1%
                                5%                                                           3.5%       3.5%
                                                                                                                           MSCI EAFE Large Value               3.54     11.39     32.77       3.64      7.57      3.46
                                0%

                                     3 M 1 Yr 3 M 1 Yr 3 M 1 Yr 3 M 1 Yr 3 M 1 Yr 3 M 1 Yr 3 M 1 Yr                        MSCI EAFE Small Value               3.47     11.18     42.77       5.75     10.13      7.09

                               TOP 5 & BOTTOM 5 COUNTRIES (Sorted by trailing 3M Performance)                                                                  3 M       YTD       1 Yr      3 Yr      5 Yr     10 Yr

                                                                                                         12.9%        Denmark                                 12.93       8.81    42.68     21.45     12.79     11.52
                                                                                                10.4%                 Switzerland                             10.45       7.41    21.96     14.04      9.75      6.00

                                                                                               10.0%                  Finland                                  9.99       7.47    32.12      5.74      9.05      4.05

                                                                                              9.8%
                                                                                                                      Austria                                  9.84     20.04     66.33      0.16     11.46     -1.52
                                                                                             9.5%
                                                                                                                      Canada                                   9.49     19.33     42.58      8.79      8.48      1.58
                                                                1.4%
                                                                                                                      Hong Kong                                1.43       8.32    25.55      3.57      7.22      4.49
                                                   -0.5%
                                                                                                                      Japan                                    -0.45      0.35    22.61      5.10      8.06      5.11
                                                 -0.8%
                                                                                                                      Singapore                                -0.84      7.84    24.30     -0.66      2.36     -1.04
                                        -3.4%
                                                                                                                      Portugal                                 -3.44     -7.57     8.21      1.27      5.27     -5.67
                                 -5.4%
                                   -6.00 -4.00 -2.00    0.00    2.00   4.00   6.00   8.00  10.00 12.00 14.00          New Zealand                              -5.41    -15.95     -6.79     8.05      5.33      4.78
                                                                                                                                                                                                Source: MSCI Country Indices.

                              Past performance is no guarantee of future results. Rankings provided based on total returns. Performance quoted for mutual funds may include performance of a predecessor
                              fund/share class prior to the share class commencement of operations.


                                                                                                                        Page 7
   21   22   23   24   25   26   27   28   29   30   31