
Page 99 - AugDefComp
P. 99
MassMutual US Govt Mny Mkt R5 MKSXX 6/30/2021
Fund Incep Date: Benchmark: Category: Net Assets: Manager Name: Manager Start Date: Expense Ratio: Expense Rank:
09/30/1994 FTSE Treasury Bill 3 Mon Money Market-Taxable $338.00M Scott Simler 07/31/2009 0.51% 51
PORTFOLIO COMPOSITION (Holdings-based) INVESTMENT OVERVIEW
Assets The investment seeks current income consistent with preservation of capital and liquidity. The fund normally invests at least 99.5% of its total assets in cash, U.S.
government securities, and/or repurchase agreements fully collateralized by cash or U.S. government securities. It invests at least 80% of its net assets in U.S.
Cash 65.82% government securities and repurchase agreements that are fully collateralized by U.S. government securities. U.S. government securities are high-quality
US Stocks 0.00% securities issued or guaranteed by the U.S. Treasury or by an agency or instrumentality of the U.S. government.
US Bonds 34.18%
Non-US Stocks 0.00%
Preferred Stocks 0.00% PERFORMANCE
Convertible Bonds 0.00%
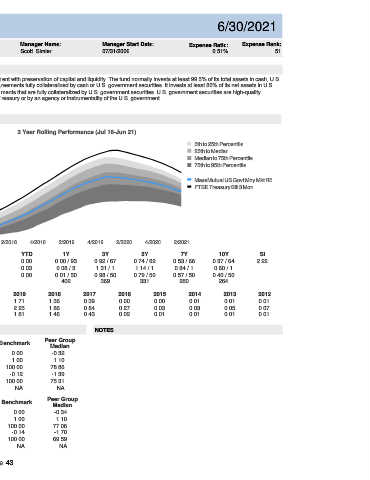
Other 0.00% 3 Year Rolling Performance (Jul 16-Jun 21)
Non-US Bonds 0.00% 2
5th to 25th Percentile
25th to Median
Median to 75th Percentile
75th to 95th Percentile
Credit Quality (%)
AAA
AA MassMutual US Govt Mny Mkt R5
A 1 FTSE Treasury Bill 3 Mon
BBB
BB
B
Below B
NR/NA
Total: 0.00%
0
4/2016 2/2017 4/2017 2/2018 4/2018 2/2019 4/2019 2/2020 4/2020 2/2021
3M YTD 1Y 3Y 5Y 7Y 10Y SI
Fund 0.00 0.00 0.00 / 93 0.92 / 67 0.74 / 62 0.53 / 66 0.37 / 64 2.22
Sector (%)
Benchmark 0.01 0.03 0.08 / 3 1.31 / 1 1.14 / 1 0.84 / 1 0.60 / 1
% Government 34.18%
% Municipal 0.00% Peer Group Median 0.00 0.00 0.01 / 50 0.98 / 50 0.79 / 50 0.57 / 50 0.40 / 50
% Corporate 0.00% Number of Funds 402 369 331 280 264
% Securitized 0.00% CALENDAR 2020 2019 2018 2017 2016 2015 2014 2013 2012
% Cash and Equivalent 65.82% Fund 0.23 1.71 1.36 0.39 0.00 0.00 0.01 0.01 0.01
% Derivative 0.00%
Benchmark 0.58 2.25 1.86 0.84 0.27 0.03 0.03 0.05 0.07
Total: 100.00%
Peer Group Median 0.27 1.81 1.46 0.43 0.02 0.01 0.01 0.01 0.01
RISK & PERFORMANCE STATISTICS NOTES
Peer Group
3 Yr Fund Benchmark
ASSET LOADINGS (Returns-based) Median
Alpha -0.38 0.00 -0.32
FUND EXPOSURES (WEIGHT) (Jul 18-Jun 21) Beta 1.09 1.00 1.10
100
75 R-Squared 75.17 100.00 78.86
Sharpe Ratio -1.75 -0.12 -1.39
50
25 Up Market Capture 70.18 100.00 75.31
0 Down Market Capture NA NA NA
Current Average
Fund Bmk Fund Bmk 5 Yr Fund Benchmark Peer Group
Cash 98.7 98.9 98.9 99.1 Median
Credit Bond 0.0 0.1 0.0 0.1 Alpha -0.40 0.00 -0.34
Govt Bond 0.0 0.0 0.0 0.0 Beta 1.09 1.00 1.10
HY Corp Bond 1.3 1.0 0.9 0.8 R-Squared 74.46 100.00 77.06
MBS 0.0 0.0 0.0 0.0 Sharpe Ratio -2.06 -0.14 -1.70
Muni Bond 0.0 0.0 0.2 0.0 Up Market Capture 64.55 100.00 69.59
TIPS 0.0 0.0 0.0 0.0 Down Market Capture NA NA NA
Page 43