
Page 103 - AugDefComp
P. 103
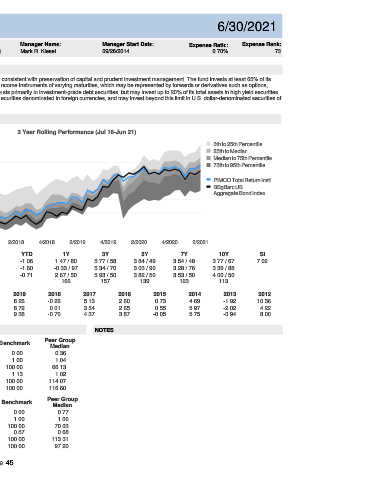
PIMCO Total Return Instl  PTTRX                                         6/30/2021


 Fund Incep Date:      Benchmark:     Category:     Net Assets:     Manager Name:    Manager Start Date:    Expense Ratio:  Expense Rank:
 05/11/1987  BBgBarc US Aggregate Bond Index  Intermediate Core-Plus Bond   $69,181.00M   Mark R. Kiesel   09/26/2014  0.70%    73


 PORTFOLIO COMPOSITION (Holdings-based)     INVESTMENT OVERVIEW
  Assets  The investment seeks maximum total return, consistent with preservation of capital and prudent investment management. The fund invests at least 65% of its
 total assets in a diversified portfolio of Fixed Income Instruments of varying maturities, which may be represented by forwards or derivatives such as options,
    Cash  23.80%       futures contracts, or swap agreements. It invests primarily in investment-grade debt securities, but may invest up to 20% of its total assets in high yield securities.
    US Stocks  0.00%       It may invest up to 30% of its total assets in securities denominated in foreign currencies, and may invest beyond this limit in U.S. dollar-denominated securities of
    US Bonds  44.44%       foreign issuers.
    Non-US Stocks  0.00%
    Preferred Stocks  0.46%       PERFORMANCE
    Convertible Bonds  1.29%
    Other  2.65%       3 Year Rolling Performance (Jul 16-Jun 21)
    Non-US Bonds  27.37%       8
                                                                       5th to 25th Percentile
 7                                                                     25th to Median
                                                                       Median to 75th Percentile
 6                                                                     75th to 95th Percentile
 Credit Quality (%)
 AAA  5
 AA                                                                    PIMCO Total Return Instl
 A  4                                                                  BBgBarc US
                                                                       Aggregate Bond Index
 BBB
 BB  3
 B
 2
 Below B
 NR/NA  1
 Total:  0.00%
 0
 4/2016  2/2017  4/2017  2/2018  4/2018  2/2019  4/2019  2/2020  4/2020  2/2021
 3M     YTD          1Y           3Y           5Y           7Y           10Y          SI
 Fund  2.09  -1.06  1.47 / 80   5.77 / 58    3.84 / 49    3.54 / 48    3.77 / 67      7.02
 Sector (%)
 Benchmark  1.83  -1.60  -0.33 / 97  5.34 / 70  3.03 / 90  3.28 / 76   3.39 / 88
 % Government  32.66%
 % Municipal  0.31%  Peer Group Median  2.12  -0.71  2.67 / 50  5.93 / 50  3.82 / 50  3.53 / 50  4.00 / 50
 % Corporate  16.96%  Number of Funds  166  157  139        123          113
 % Securitized  20.83%  CALENDAR  2020  2019  2018  2017  2016  2015  2014  2013      2012
 % Cash and Equivalent  13.30%  Fund  8.88  8.26  -0.26  5.13  2.60  0.73  4.69  -1.92  10.36
 % Derivative  15.93%
 Benchmark  7.51  8.72  0.01  3.54      2.65        0.55       5.97       -2.02        4.22
 Total:  99.99%
 Peer Group Median  8.33  9.38  -0.70  4.37  3.87  -0.05       5.75       -0.94        8.00

 RISK & PERFORMANCE STATISTICS   NOTES
                Peer Group
 3 Yr  Fund  Benchmark
 ASSET LOADINGS  (Returns-based)     Median
 Alpha  0.50  0.00  0.36
 FUND EXPOSURES (WEIGHT) (Jul 18-Jun 21)  Beta  0.98  1.00  1.04
 100
 75  R-Squared  88.82  100.00  66.13
 Sharpe Ratio  1.22  1.13  1.02
 50
 25  Up Market Capture  104.02  100.00  114.07
 0  Down Market Capture  95.83  100.00  116.60
 Current       Average
 Fund  Bmk   Fund   Bmk   5 Yr  Fund  Benchmark  Peer Group
 Cash  2.0   1.4   9.2   1.3   Median
 Credit Bond  30.6   29.9   26.5   30.0   Alpha  0.82  0.00  0.77
 Govt Bond  31.0   42.2   39.7   41.9   Beta  0.99  1.00  1.00
 HY Corp Bond  0.4   0.2   2.5   0.1   R-Squared  89.60  100.00  70.03
 MBS  13.8   24.7   3.5   25.2   Sharpe Ratio  0.80  0.57  0.68
 Muni Bond  9.6   1.3   8.8   1.3   Up Market Capture  108.52  100.00  113.31
 TIPS  12.6   0.2   9.9   0.2   Down Market Capture  89.76  100.00  97.20

 Page 45