
Page 101 - AugDefComp
P. 101
Vanguard Total Bond Market Index I VBTIX 6/30/2021
Fund Incep Date: Benchmark: Category: Net Assets: Manager Name: Manager Start Date: Expense Ratio: Expense Rank:
09/18/1995 BBgBarc US Aggregate Bond Index Intermediate Core Bond $312,151.00M Joshua C. Barrickman 02/22/2013 0.04% 6
PORTFOLIO COMPOSITION (Holdings-based) INVESTMENT OVERVIEW
Assets The investment seeks to track the performance of the Bloomberg Barclays U.S. Aggregate Float Adjusted Index. This index measures the performance of a wide
spectrum of public, investment-grade, taxable, fixed income securities in the United States-including government, corporate, and international dollar-denominated
Cash 0.14% bonds, as well as mortgage-backed and asset-backed securities-all with maturities of more than 1 year. All of the fund's investments will be selected through the
US Stocks 0.00% sampling process, and at least 80% of its assets will be invested in bonds held in the index.
US Bonds 91.35%
Non-US Stocks 0.00%
Preferred Stocks 0.00% PERFORMANCE
Convertible Bonds 0.84%
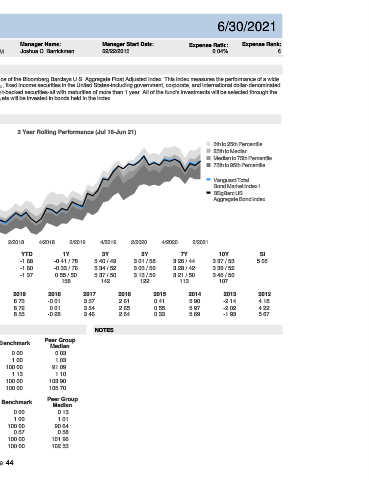
Other 0.00% 3 Year Rolling Performance (Jul 16-Jun 21)
Non-US Bonds 7.68% 7
5th to 25th Percentile
6 25th to Median
Median to 75th Percentile
Credit Quality (%) 5 75th to 95th Percentile
AAA 68.56%
AA 3.07% 4 Vanguard Total
Bond Market Index I
A 12.18%
BBB 16.09% 3 BBgBarc US
Aggregate Bond Index
BB 0.00%
B 0.00% 2
Below B 0.01%
NR/NA 0.09% 1
Total: 100.00%
0
4/2016 2/2017 4/2017 2/2018 4/2018 2/2019 4/2019 2/2020 4/2020 2/2021
3M YTD 1Y 3Y 5Y 7Y 10Y SI
Fund 2.00 -1.68 -0.41 / 78 5.40 / 49 3.01 / 58 3.26 / 44 3.37 / 53 5.05
Sector (%)
Benchmark 1.83 -1.60 -0.33 / 76 5.34 / 52 3.03 / 56 3.28 / 42 3.39 / 52
% Government 46.90%
% Municipal 0.73% Peer Group Median 1.86 -1.37 0.55 / 50 5.37 / 50 3.13 / 50 3.21 / 50 3.45 / 50
% Corporate 28.82% Number of Funds 158 142 122 113 107
% Securitized 23.41% CALENDAR 2020 2019 2018 2017 2016 2015 2014 2013 2012
% Cash and Equivalent 0.14% Fund 7.74 8.73 -0.01 3.57 2.61 0.41 5.90 -2.14 4.18
% Derivative 0.00%
Benchmark 7.51 8.72 0.01 3.54 2.65 0.55 5.97 -2.02 4.22
Total: 100.00%
Peer Group Median 7.65 8.55 -0.28 3.46 2.64 0.33 5.69 -1.93 5.67
RISK & PERFORMANCE STATISTICS NOTES
Peer Group
3 Yr Fund Benchmark
ASSET LOADINGS (Returns-based) Median
Alpha -0.10 0.00 0.03
FUND EXPOSURES (WEIGHT) (Jul 18-Jun 21) Beta 1.04 1.00 1.03
100
75 R-Squared 99.20 100.00 91.09
Sharpe Ratio 1.10 1.13 1.10
50
25 Up Market Capture 102.43 100.00 103.90
0 Down Market Capture 105.20 100.00 105.70
Current Average
Fund Bmk Fund Bmk 5 Yr Fund Benchmark Peer Group
Cash 0.9 1.4 5.7 1.3 Median
Credit Bond 29.6 29.9 30.3 30.0 Alpha -0.09 0.00 0.15
Govt Bond 50.1 42.2 50.0 41.9 Beta 1.04 1.00 1.01
HY Corp Bond 0.8 0.2 0.2 0.1 R-Squared 99.16 100.00 90.64
MBS 14.8 24.7 10.1 25.2 Sharpe Ratio 0.55 0.57 0.58
Muni Bond 3.8 1.3 3.8 1.3 Up Market Capture 101.99 100.00 101.96
TIPS 0.0 0.2 0.1 0.2 Down Market Capture 104.50 100.00 102.53
Page 44