
Page 39 - FebDefComp
P. 39
11
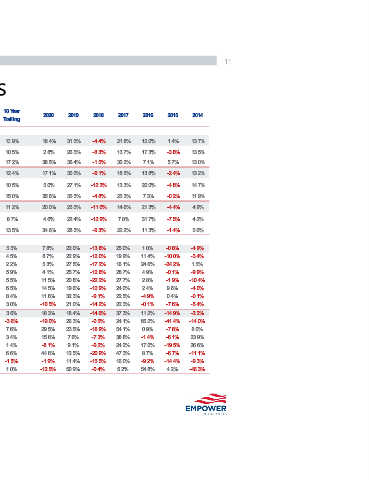
2014 13.7% 13.5% 13.0% 13.2% 14.7% 11.9% 4.9% 4.2% 5.6% -4.9% -3.4% 1.5% -9.9% -10.4% -4.0% -0.1% -5.4% -2.2% -14.0% 8.0% 23.9% 26.6% -11.1% -9.3% -46.3%
2015 1.4% -3.8% 5.7% -2.4% -4.8% -0.2% -4.4% -7.5% -1.4% -0.8% -10.0% -24.2% -0.1% -1.9% 9.6% 0.4% -7.6% -14.9% -41.4% -7.8% -6.1% -19.5% -6.7% -14.4% 4.2%
2016 12.0% 17.3% 7.1% 13.8% 20.0% 7.3% 21.3% 31.7% 11.3% 1.0% 11.4% 24.6% 4.9% 2.8% 2.4% -4.9% -0.1% 11.2% 66.2% 0.9% -1.4% 17.0% 8.7% -9.2% 54.8%
2017 21.8% 13.7% 30.2% 18.5% 13.3% 25.3% 14.6% 7.8% 22.2% 25.0% 19.9% 16.1% 28.7% 27.7% 24.0% 22.5% 22.3% 37.3% 24.1% 54.1% 38.8% 24.2% 47.3% 16.0% 5.2%
2018 -4.4% -8.3% -1.5% -9.1% -12.3% -4.8% -11.0% -12.9% -9.3% -13.8% -12.0% -17.2% -12.8% -22.2% -12.9% -9.1% -14.2% -14.6% -0.5% -18.9% -7.3% -9.2% -20.9% -15.5% -0.4%
2019 31.5% 26.5% 36.4% 30.5% 27.1% 35.5% 25.5% 22.4% 28.5% 22.0% 22.9% 27.5% 25.7% 20.8% 19.6% 32.3% 21.0% 18.4% 26.3% 23.5% 7.6% 9.1% 12.5% 11.4% 50.9%
2020 18.4% 2.8% 38.5% 17.1% 5.0% 35.6% 20.0% 4.6% 34.6% 7.8% 8.7% 5.3% 4.1% 11.5% 14.5% 11.6% -10.5% 18.3% -19.0% 29.5% 15.6% -8.1% 44.6% -1.9% -12.5%
ear railing 8.7% 5.5% 4.5% 2.2% 5.9% 5.5% 6.5% 8.4% 3.0% 3.6% 7.6% 3.4% 1.4% 6.6% 1.0%
10 Y T 13.9% 10.5% 17.2% 12.4% 10.5% 15.0% 11.2% 13.5% -3.6% -1.5%
Equity Market Returns
ear Trailing 15.2% 9.7% 21.0% 13.4% 9.7% 18.7% 13.3% 9.7% 16.4% 7.4% 9.5% 10.0% 9.0% 6.6% 8.7% 9.4% 2.6% 12.8% 16.0% 15.1% 9.5% 5.8% 15.6% -0.6% 16.5%
5 Y
ear Trailing 14.2% 6.1% 23.0% 11.6% 5.4% 20.5% 10.2% 3.7% 16.2% 4.3% 5.6% 3.6% 4.5% 1.6% 6.1% 10.3% -2.4% 6.2% 0.6% 9.1% 4.8% -3.1% 8.8% -2.6% 9.6%
3 Y
ear Trailing 18.4% 2.8% 38.5% 17.1% 5.0% 35.6% 20.0% 4.6% 34.6% 7.8% 8.7% 5.3% 4.1% 11.5% 14.5% 11.6% -10.5% 18.3% -19.0% 29.5% 15.6% -8.1% 44.6% -1.9% -12.5%
1 Y
D
T 18.4% 2.8% 38.5% 17.1% 5.0% 35.6% 20.0% 4.6% 34.6% 7.8% 8.7% 5.3% 4.1% 11.5% 14.5% 11.6% -10.5% 18.3% -19.0% 29.5% 15.6% -8.1% 44.6% -1.9% -12.5%
Y
D Individual country returns are represented by MSCI indices and shown as USD returns
QT 12.1% 16.3% 11.4% 19.9% 20.4% 19.0% 31.4% 33.4% 29.6% 16.0% 22.9% 13.9% 20.4% 11.5% 15.3% 8.2% 16.9% 19.7% 37.0% 11.2% 21.0% 31.8% 38.3% 31.0% 21.6% Past performance is not a guarantee or prediction of future results. FOR FINANCIAL PROFESSIONAL AND PLAN SPONSOR USE ONLY.
ecember 31, 2020) uity q E tic &P500 ussell 1000 Value ussell 1000 Gowth r ap Russell Mid C ap Value Russell Mid C ap Gowth r Russell Mid C ussell 2000 ussell 2000 Value ussell 2000 Gowth r uity q nal E E AF I E C Australia anada rance ermany erland merging Markets I E C i hina Indonesia Mexico ussia Source: Morningstar Direct; GWCM Analysis *Canada is not part of the EAFE Index
(as of D mes o D S R L arge C ap R Mid C ap R R S mall C ap R Internatio MS C F G apan J D eveloped Markets witz S K U MS Brazl C India Korea E merging Markets R