
Page 207 - NovDefComp
P. 207
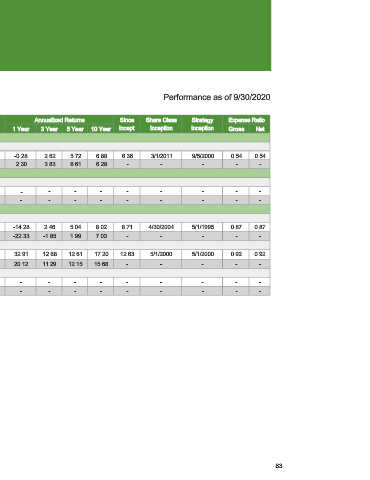
Returns Analysis


                                                       Performance as of 9/30/2020


 Ticker/    Annualized Returns          Since    Share Class    Strategy    Expense Ratio
 Active  Q T R  YTD
 I D  1 Year  3 Year   5 Year  10 Year  Incept.   Inception     Inception   Gross    Net
 Fixed Income
 High Yield
 MassMutual Premier High Yield I  MPHZX  4.48  -2.15  -0.28  2.62  5.72  6.88  6.36  3/1/2011  9/5/2000  0.54  0.54
 BofA ML US High Yield Master II Index  4.71  -0.30  2.30  3.83  6.61  6.28  -  -  -  -  -
 Cash Alternatives
 Stable Value
 SAGIC Core Bond  -  -  -  -  -   -        -          -            -           -      -
 No Benchmark Data  -  -  -  -  -  -       -          -            -           -      -
 Specialty
 R E IT
 Invesco Real Estate R5  IARIX  0.04  -14.36  -14.28  2.46  5.04  8.02  8.71  4/30/2004  5/1/1995  0.87  0.87
 DJUSslct REIT United States  0.83  -21.36  -22.33  -1.85  1.99  7.03  -  -  -  -     -
 HealthCare
 Hartford Healthcare HLS IA   HIAHX  6.32  11.35  32.91  12.68  12.61  17.20  12.63  5/1/2000  5/1/2000  0.92  0.92
 S&P 1500 Health Care  5.83  5.17  20.12  11.29  12.15  15.68  -  -  -         -      -
 Specialty
 Schwab PCRA  schwab.massmutual  -  -  -  -  -  -  -  -            -           -      -
 No Benchmark Data  -  -  -  -  -  -       -          -            -           -      -


                                                                                            83