
Page 210 - NovDefComp
P. 210
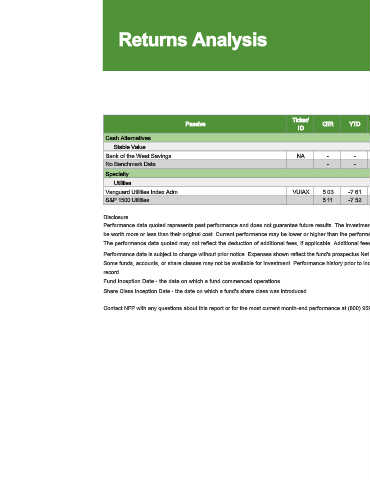
Returns Analysis


                                                                                                                                                                                 Performance as of 9/30/2020


                                                                                                 Ticker/                             Annualized Returns           Since   Share Class     Strategy     Expense Ratio
                                                              Passive                                      Q T R    YTD
                                                                                                   I D                       1 Year    3 Year  5 Year   10 Year  Incept.    Inception     Inception   Gross     Net
                                    Cash Alternatives
                                      Stable Value
                                    Bank of the West Savings                                       NA        -       -         -         -        -        -        -          -             -           -       -
                                    No Benchmark Data                                                        -       -         -         -        -        -        -          -             -           -       -
                                    Specialty
                                      Utilities
                                    Vanguard Utilities Index Adm                                 VUIAX     5.03     -7.61    -7.32      6.65    10.19    10.61    9.62     4/28/2004     4/28/2004     0.10    0.10
                                    S&P 1500 Utilities                                                     5.11     -7.52    -7.06      6.71    10.16    10.74      -          -             -           -       -

                                   Disclosure
                                   Performance data quoted represents past performance and does not guarantee future results. The investment return and principal value of an investment will fluctuate so that an investor's shares, when redeemed, may
                                   be worth more or less than their original cost. Current performance may be lower or higher than the performance data quoted.
                                   The performance data quoted may not reflect the deduction of additional fees, if applicable. Additional fees would reduce the performance quoted.
                                   Performance data is subject to change without prior notice. Expenses shown reflect the fund's prospectus Net and Gross expense ratios.
                                   Some funds, accounts, or share classes may not be available for investment. Performance history prior to inception (if applicable) reflects another share class or account reflecting the manager's historical performance
                                   record.
                                   Fund Inception Date - the date on which a fund commenced operations.
                                   Share Class Inception Date - the date on which a fund's share class was introduced.

                                   Contact NFP with any questions about this report or for the most current month-end performance at (800) 959-0071.


                                                                                                                                                                                                                      85