
Page 209 - NovDefComp
P. 209
Returns Analysis
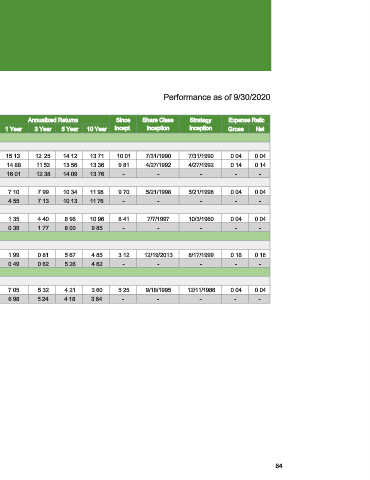
Performance as of 9/30/2020
Ticker/ Annualized Returns Since Share Class Strategy Expense Ratio
Passive Q T R YTD
I D 1 Year 3 Year 5 Year 10 Year Incept. Inception Inception Gross Net
U.S. Equity
Large Cap Blend
Vanguard Institutional Index I VINIX 8.92 5.57 15.13 12.25 14.12 13.71 10.01 7/31/1990 7/31/1990 0.04 0.04
Vanguard Total Stock Mkt Idx Inv VTSMX 9.18 5.42 14.88 11.53 13.56 13.36 9.81 4/27/1992 4/27/1992 0.14 0.14
Russell 1000 Index 9.47 6.40 16.01 12.38 14.09 13.76 - - - - -
Mid Cap Blend
Vanguard Mid Cap Index Institutional VMCIX 7.94 0.21 7.10 7.99 10.34 11.98 9.70 5/21/1998 5/21/1998 0.04 0.04
Russell Mid-Cap Index 7.46 -2.35 4.55 7.13 10.13 11.76 - - - - -
Small Cap Blend
Vanguard Small Cap Index I VSCIX 5.80 -6.28 1.35 4.40 8.96 10.96 8.41 7/7/1997 10/3/1960 0.04 0.04
Russell 2000 Index 4.93 -8.69 0.39 1.77 8.00 9.85 - - - - -
International/Global Equity
International Large Cap Blend
Vanguard Developed Markets Index Inv VDVIX 5.59 -5.83 1.99 0.81 5.67 4.85 3.12 12/19/2013 8/17/1999 0.16 0.16
MSCI EAFE ND USD 4.80 -7.09 0.49 0.62 5.26 4.62 - - - - -
Fixed Income
Core Fixed Income
Vanguard Total Bond Market Index I VBTIX 0.62 7.02 7.05 5.32 4.21 3.60 5.25 9/18/1995 12/11/1986 0.04 0.04
BB Aggregate Bond 0.62 6.79 6.98 5.24 4.18 3.64 - - - - -
84