
Page 358 - DCAC February 2024 Files
P. 358
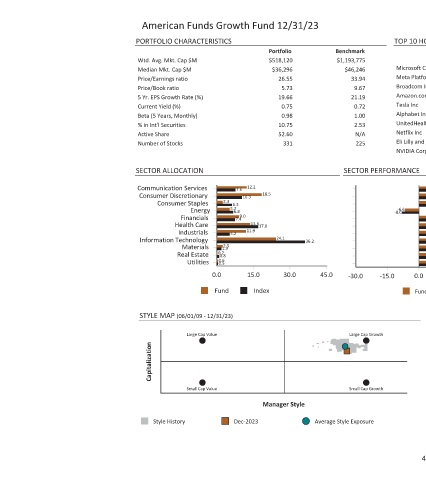
TOP 10 HOLDINGS  Quarterly Benchmark  Portfolio  Return (%) Weight (%) Weight (%)  19.34  13.10  6.42 Microsoft Corp  17.90  3.68  4.79 Meta Platforms Inc  35.01  2.30  3.67 Broadcom Inc  19.52  6.48  3.23 Amazon.com Inc  -0.70  3.22  2.32  Tesla Inc  6.89  3.29  1.97 Alphabet Inc  4.78  0.87  1.94 UnitedHealth Group Incorporated  28.94  1.00  1.83 Netflix Inc  8.73  2.18  1.80 Eli Lilly and Co  13.86  5.73  1.76 NVID


             Benchmark  $1,193,775  $46,246  33.94  9.67  21.19  0.72  1.00  2.53  N/A  225  SECTOR PERFORMANCE  -30.0  Large Cap Growth  Small Cap Growth  Average Style Exposure


                                                               45.0
       American Funds Growth Fund 12/31/23
                                                        36.2

             Portfolio  $518,120  $36,296  26.55  5.73  19.66  0.75  0.98  10.75  52.60  331  24.1  30.0  Manager Style

                                             18.5                  Index
                                           12.2  10.3  13.6 17.0  11.9  15.0                    Dec-2023
                                            7.6  6.8  9.0  7.4
                                               6.3 2.3  5.2  5.2  2.5  1.9  0.2  0.8  0.6  0.5  0.0  Fund
           PORTFOLIO CHARACTERISTICS  Wtd. Avg. Mkt. Cap $M  Median Mkt. Cap $M  Price/Earnings ratio  Price/Book ratio  5 Yr. EPS Growth Rate (%)  Current Yield (%)  Beta (5 Years, Monthly)  % in Int'l Securities  Active Share  Number of Stocks  SECTOR ALLOCATION  Communication Services Consumer Discretionary  Consumer Staples  Energy  Financials  Health Care  Industrials Information Technology  Materials  Real Estate  Utilitie