
Page 353 - DCAC February 2024 Files
P. 353
24.0 (20) (20) (20) (20)
20.0 Standard Deviation 18.37 18.37 18.29 2016 11.97 11.96 9.70 3 Years Ending Dec-2017 11.41 11.41 10.39
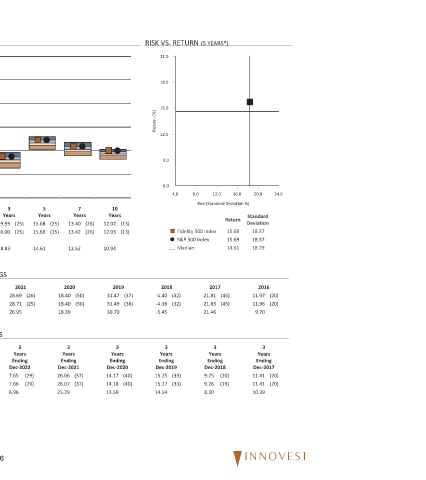
16.0 Return 15.68 15.69 14.61
(5 YEARS*) 12.0 8.0 Risk (Standard Deviation %) Fidelity 500 Index S&P 500 Index 2017 (45) 21.81 (45) 21.83 21.46 3 Years Ending Dec-2018 (20) 9.25 (19) 9.26 8.30
RISK VS. RETURN 21.0 18.0 15.0 Return (%) 12.0 9.0 6.0 4.0 Median 2018 (32) -4.40 (32) -4.38 -5.45 3 Years Ending Dec-2019 (33) 15.25 (33) 15.27 14.54
(13) (13) (37) (36) (40) (40)
10 Years 12.02 12.03 10.94 2019 31.47 31.49 30.70 3 Years Ending Dec-2020 14.17 14.18 13.59
(26) (26)
Years (50) (50)
7 13.40 13.42 12.52 2020 3 Years Ending Dec-2021 (37) (37)
(25) (25) 18.40 18.40 18.39 26.06 26.07 25.29
5 Years 15.68 15.69 14.61
(26) (25) (29) (29)
(25) (25) 2021 28.69 28.71 26.95 3 Years Ending Dec-2022
3 Years 9.99 10.00 8.83 7.65 7.66 6.96 46
PEER GROUP ANALYSIS - IM U.S. Large Cap Core Equity (MF)
(37) (37) (45) (45) (25) (25)
1 Year 26.29 26.29 24.85 2022 -18.13 -18.11 -18.72 3 Years Ending Dec-2023 9.99 10.00 8.83
(37) (37)
Year To Date 26.29 26.29 24.85
(51) (51) CALENDAR YEAR RETURNS AND PERCENTILE RANKINGS ROLLING 3 YEAR RETURN AND PERCENTILE RANKINGS
Last Quarter 11.69 11.69 11.70
Fidelity 500 Index S&P 500 Index Median Fidelity 500 Index S&P 500 Index Fidelity 500 Index S&P 500 Index
44.0 36.0 28.0 20.0 12.0 4.0 -4.0 IM U.S. Large Cap Core Equity (MF) Median IM U.S. Large Cap Core Equity (MF) Median
Return
Fidelity 500 Index 12/31/23 FUND INFORMATION Fidelity Investments Fund Family : 05/04/2011 Fund Inception : Team Managed Portfolio Manager : $484,415 Million Total Assets : 3% Turnover : Investment Stratgey: The fund employs a "passive management"-or indexing-investment approach designed to mimic the performance of the S&P 500 Index, a broadly diversified index of stocks of predominantly large U.S. companies.