
Page 354 - DCAC February 2024 Files
P. 354
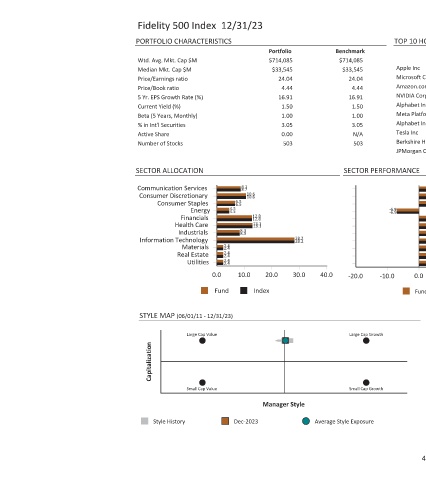
TOP 10 HOLDINGS  Quarterly Benchmark  Portfolio  Return (%) Weight (%) Weight (%)  12.60  7.03  7.03  Apple Inc  19.34  6.98  6.98 Microsoft Corp  19.52  3.45  3.45 Amazon.com Inc  13.86  3.06  3.06 NVIDIA Corporation  6.75  2.06  2.06 Alphabet Inc  17.90  1.96  1.96 Meta Platforms Inc  6.89  1.75  1.75 Alphabet Inc  -0.70  1.72  1.72  Tesla Inc  1.82  1.62  1.62 Berkshire Hathaway Inc  18.16  1.23  1.23 JPMorgan Chas


             Benchmark  $714,085  $33,545  24.04  4.44  16.91  1.50  1.00  3.05  N/A  503  SECTOR PERFORMANCE  -20.0  Large Cap Growth  Small Cap Growth  Average Style Exposure


                                                               40.0


                                                       28.2  28.2  30.0
             Portfolio  $714,085  $33,545  24.04  4.44  16.91  1.50  1.00  3.05  0.00  503  8.7  8.7  10.6  10.6  12.8  12.8  13.1  13.1  8.3  8.3  20.0  10.0  Index  Manager Style  Dec-2023


       Fidelity 500 Index  12/31/23  PORTFOLIO CHARACTERISTICS  Wtd. Avg. Mkt. Cap $M  Median Mkt. Cap $M  Price/Earnings ratio  Price/Book ratio  5 Yr. EPS Growth Rate (%)  Current Yield (%)  Beta (5 Years, Monthly)  % in Int'l Securities  Active Share  Number of Stocks  SECTOR ALLOCATION  Communication Services Consumer Discretionary  6.5 Consumer Staples  4.5 6.5  Energy  4.5  Financials  Health Care  Industrials Information