
Page 105 - AugDefComp
P. 105
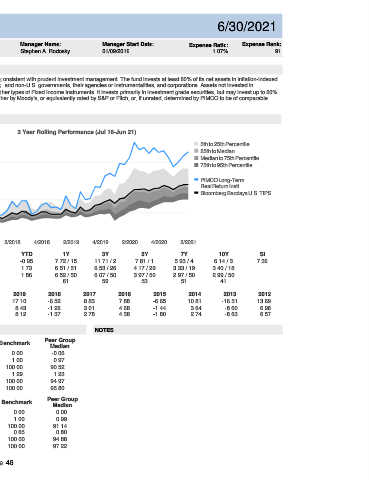
PIMCO Long-Term Real Return Instl  PRAIX                                6/30/2021


 Fund Incep Date:      Benchmark:     Category:     Net Assets:     Manager Name:    Manager Start Date:    Expense Ratio:  Expense Rank:
 11/12/2001  Bloomberg Barclays U.S. TIPS  Inflation-Protected Bond   $519.00M   Stephen A. Rodosky   01/09/2019  1.07%    91


 PORTFOLIO COMPOSITION (Holdings-based)     INVESTMENT OVERVIEW
  Assets  The investment seeks maximum real return, consistent with prudent investment management. The fund invests at least 80% of its net assets in inflation-indexed
 bonds of varying maturities issued by the U.S. and non-U.S. governments, their agencies or instrumentalities, and corporations. Assets not invested in
    Cash  22.84%       inflation-indexed bonds may be invested in other types of Fixed Income Instruments. It invests primarily in investment grade securities, but may invest up to 20%
    US Stocks  0.00%       of its total assets in junk bonds rated B or higher by Moody's, or equivalently rated by S&P or Fitch, or, if unrated, determined by PIMCO to be of comparable
    US Bonds  62.85%       quality.
    Non-US Stocks  0.00%
    Preferred Stocks  0.00%       PERFORMANCE
    Convertible Bonds  0.19%
    Other  0.08%       3 Year Rolling Performance (Jul 16-Jun 21)
    Non-US Bonds  14.04%       14
                                                                   5th to 25th Percentile
 12                                                                25th to Median
                                                                   Median to 75th Percentile
 10                                                                75th to 95th Percentile
 Credit Quality (%)
 AAA  8
 AA                                                                PIMCO Long-Term
 A  6                                                              Real Return Instl
                                                                   Bloomberg Barclays U.S. TIPS
 BBB
 BB  4
 B
 2
 Below B
 NR/NA  0
 Total:  0.00%
 -2
 4/2016  2/2017  4/2017  2/2018  4/2018  2/2019  4/2019  2/2020  4/2020  2/2021
 3M     YTD          1Y           3Y           5Y           7Y           10Y          SI
 Fund  8.31  -0.95  7.72 / 15   11.71 / 2    7.81 / 1     5.93 / 4     6.14 / 3       7.32
 Sector (%)
 Benchmark  3.25  1.73  6.51 / 51  6.53 / 26  4.17 / 29   3.33 / 19    3.40 / 18
 % Government  63.34%
 % Municipal  0.00%  Peer Group Median  3.07  1.86  6.52 / 50  6.07 / 50  3.97 / 50  2.97 / 50  2.99 / 50
 % Corporate  0.72%  Number of Funds  61  59   53           51           41
 % Securitized  10.97%  CALENDAR  2020  2019  2018  2017  2016  2015  2014  2013      2012
 % Cash and Equivalent  14.86%  Fund  27.21  17.10  -6.52  8.83  7.88  -6.65  10.81  -16.51  13.69
 % Derivative  10.12%
 Benchmark  10.99  8.43  -1.26  3.01    4.68       -1.44        3.64       -8.60       6.98
 Total:  100.01%
 Peer Group Median  10.19  8.12  -1.37  2.78  4.38  -1.80       2.74       -8.63       6.57

 RISK & PERFORMANCE STATISTICS   NOTES
                Peer Group
 3 Yr  Fund  Benchmark
 ASSET LOADINGS  (Returns-based)     Median
 Alpha  -2.42  0.00  -0.06
 FUND EXPOSURES (WEIGHT) (Jul 18-Jun 21)  Beta  2.52  1.00  0.97
 100
 75  R-Squared  80.75  100.00  90.52
 Sharpe Ratio  0.93  1.29  1.23
 50
 25  Up Market Capture  214.20  100.00  94.97
 0  Down Market Capture  258.61  100.00  95.80
 Current       Average
 Fund  Bmk   Fund   Bmk   5 Yr  Fund  Benchmark  Peer Group
 Cash  0.0   0.0   0.0   0.0   Median
 Credit Bond  69.7   0.0   42.6   0.0   Alpha  -0.39  0.00  0.00
 Govt Bond  30.3   0.0   25.3   0.0   Beta  2.41  1.00  0.99
 HY Corp Bond  0.0   0.0   0.0   0.0   R-Squared  81.31  100.00  91.14
 MBS  0.0   0.0   0.0   0.0   Sharpe Ratio  0.72  0.85  0.80
 Muni Bond  0.0   0.0   0.0   0.0   Up Market Capture  216.74  100.00  94.88
 TIPS  0.0   100.0   32.0   100.0   Down Market Capture  235.54  100.00  97.22

 Page 46