
Page 111 - AugDefComp
P. 111
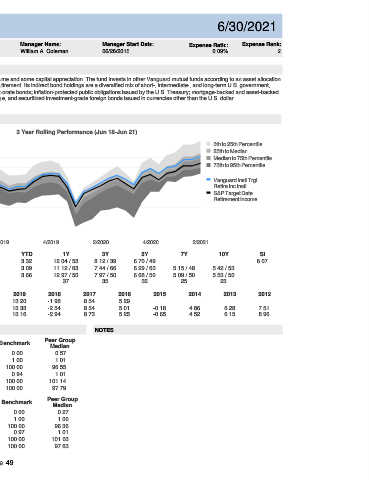
Vanguard Instl Trgt Retire Inc Instl  VITRX                             6/30/2021


 Fund Incep Date:      Benchmark:     Category:     Net Assets:     Manager Name:    Manager Start Date:    Expense Ratio:  Expense Rank:
 06/26/2015  S&P Target Date Retirement Income  Target-Date Retirement   $9,406.00M   William A. Coleman   06/26/2015  0.09%    2


 PORTFOLIO COMPOSITION (Holdings-based)     INVESTMENT OVERVIEW
  Assets  The investment seeks to provide current income and some capital appreciation. The fund invests in other Vanguard mutual funds according to an asset allocation
 strategy designed for investors currently in retirement. Its indirect bond holdings are a diversified mix of short-, intermediate-, and long-term U.S. government,
    Cash  1.35%       U.S. agency, and investment-grade U.S. corporate bonds; inflation-protected public obligations issued by the U.S. Treasury; mortgage-backed and asset-backed
    US Stocks  17.99%       securities; and government, agency, corporate, and securitized investment-grade foreign bonds issued in currencies other than the U.S. dollar.
    US Bonds  50.67%
    Non-US Stocks  11.81%
    Preferred Stocks  0.00%       PERFORMANCE
    Convertible Bonds  0.47%
    Other  0.01%       3 Year Rolling Performance (Jun 18-Jun 21)
    Non-US Bonds  17.71%       10
 Sector Breakdown                                                      5th to 25th Percentile
 9                                                                     25th to Median
 Sensitive  8
 Communication Services  9.04%                                         Median to 75th Percentile
 Industrials  11.12%  7                                                75th to 95th Percentile
 Technology  18.66%
 6                                                                     Vanguard Instl Trgt
 Energy  3.35%
 5                                                                     Retire Inc Instl
 Cyclical                                                              S&P Target Date
 Basic Materials  4.97%  4                                             Retirement Income
 Consumer Cyclical  11.99%  3
 Real Estate  3.64%
 Financial Services  16.15%  2
 Defensive  1
 Consumer Defensive  6.68%  0
 Healthcare  11.75%  2/2018  4/2018  2/2019  4/2019  2/2020  4/2020  2/2021
 Utilities  2.65%
 3M     YTD          1Y           3Y           5Y           7Y           10Y          SI
 TOP 10 HOLDINGS
 Fund  3.21  3.32  12.04 / 53   8.12 / 39    6.70 / 49                                6.07
 Vanguard Total Bond Market II Idx Inv  37.61%
 Benchmark  3.06  3.09  11.12 / 63  7.44 / 66  6.29 / 63  5.15 / 48    5.42 / 53
 Vanguard Total Stock Market Idx I  18.09%  Peer Group Median  3.34  3.66  12.97 / 50  7.97 / 50  6.68 / 50  5.09 / 50  5.53 / 50
 Vanguard Shrt-Term Infl-Prot Sec Idx Adm  16.98%
 Number of Funds     37           35           32           25           23
 Vanguard Total Intl Bd II Idx Admiral  15.56%
 Vanguard Total Intl Stock Index Inv  11.71%  CALENDAR  2020  2019  2018  2017  2016  2015  2014  2013  2012
       Fund  10.18  13.20  -1.98  8.54  5.29
       Benchmark  8.81  13.33  -2.54  8.54  5.01   -0.18       4.86        6.28       7.51
       Peer Group Median  9.51  13.16  -2.94  8.73  5.25  -0.65  4.52      6.15       8.96


 RISK & PERFORMANCE STATISTICS   NOTES
 Total:  99.96%
                Peer Group
 3 Yr  Fund  Benchmark
 ASSET LOADINGS  (Returns-based)     Median
 Alpha  0.92  0.00  0.57
 FUND EXPOSURES (WEIGHT) (Jul 18-Jun 21)  Beta  0.95  1.00  1.01
 100
 75  R-Squared  98.93  100.00  96.55
 Sharpe Ratio  1.09  0.94  1.01
 50
 25  Up Market Capture  100.47  100.00  101.14
 0  Down Market Capture  89.24  100.00  97.79
 Current       Average
 Fund  Bmk   Fund   Bmk   5 Yr  Fund  Benchmark  Peer Group
 Cash  15.5   21.1   12.4   19.7   Median
 US Bonds  48.3   41.4   52.5   43.4   Alpha  0.61  0.00  0.27
 Intl Bonds  5.7   5.9   4.2   3.8   Beta  0.95  1.00  1.00
 Intl Equity  8.2   5.4   10.0   7.9   R-Squared  98.67  100.00  96.36
 US Equity  22.3   26.3   20.9   25.2   Sharpe Ratio  1.09  0.97  1.01
 Up Market Capture  100.11  100.00  101.03
 Down Market Capture  90.40  100.00  97.63

 Page 49