
Page 107 - AugDefComp
P. 107
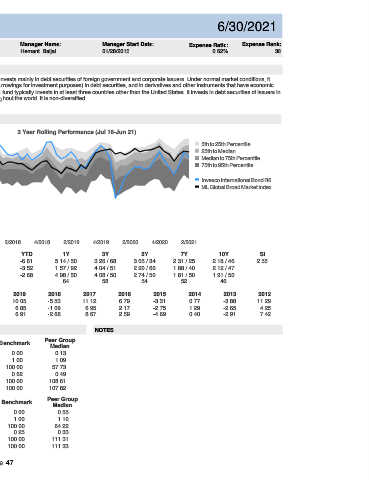
Invesco International Bond R6  OIBIX                                    6/30/2021


 Fund Incep Date:      Benchmark:     Category:     Net Assets:     Manager Name:    Manager Start Date:    Expense Ratio:  Expense Rank:
 01/27/2012  ML Global Broad Market Index  World Bond   $2,417.00M   Hemant  Baijal   01/28/2013  0.62%    38


 PORTFOLIO COMPOSITION (Holdings-based)     INVESTMENT OVERVIEW
  Assets  The investment seeks total return. The fund invests mainly in debt securities of foreign government and corporate issuers. Under normal market conditions, it
 invests at least 80% of its net assets (plus borrowings for investment purposes) in debt securities, and in derivatives and other instruments that have economic
    Cash  64.28%       characteristics similar to such securities. The fund typically invests in at least three countries other than the United States. It invests in debt securities of issuers in
    US Stocks  0.00%       both developed and emerging markets throughout the world. It is non-diversified.
    US Bonds  0.18%
    Non-US Stocks  0.00%
    Preferred Stocks  0.00%       PERFORMANCE
    Convertible Bonds  0.60%
    Other  1.89%       3 Year Rolling Performance (Jul 16-Jun 21)
    Non-US Bonds  33.05%       6
                                                                   5th to 25th Percentile
 4                                                                 25th to Median
                                                                   Median to 75th Percentile
 Credit Quality (%)  2                                             75th to 95th Percentile
 AAA  32.23%
 AA  0.89%  0                                                      Invesco International Bond R6
                                                                   ML Global Broad Market Index
 A  1.09%
 BBB  26.08%  -2
 BB  23.20%
 B  7.32%  -4
 Below B  4.47%
 NR/NA  4.73%  -6
 Total:  100.01%
 -8
 4/2016  2/2017  4/2017  2/2018  4/2018  2/2019  4/2019  2/2020  4/2020  2/2021
 3M     YTD          1Y           3Y           5Y           7Y           10Y          SI
 Fund  0.07  -6.61  5.14 / 50   3.26 / 68    3.05 / 34    2.31 / 25    2.18 / 46      2.55
 Sector (%)
 Benchmark  1.31  -3.52  1.57 / 92  4.04 / 51  2.20 / 66  1.88 / 40    2.12 / 47
 % Government  25.59%
 % Municipal  0.00%  Peer Group Median  1.29  -2.68  4.98 / 50  4.08 / 50  2.74 / 50  1.81 / 50  1.91 / 50
 % Corporate  5.34%  Number of Funds  64  58   54           52           46
 % Securitized  2.70%  CALENDAR  2020  2019  2018  2017  2016  2015  2014  2013       2012
 % Cash and Equivalent  21.72%  Fund  8.47  10.05  -5.53  11.12  6.79  -3.31  0.77  -3.88  11.29
 % Derivative  44.65%
 Benchmark  8.94  6.85  -1.09  6.95     2.17       -2.75       1.29       -2.65        4.25
 Total:  100.00%
 Peer Group Median  8.57  6.91  -2.68  8.67  2.59  -4.69       0.40       -2.91        7.42

 RISK & PERFORMANCE STATISTICS   NOTES
                Peer Group
 3 Yr  Fund  Benchmark
 ASSET LOADINGS  (Returns-based)     Median
 Alpha  -1.76  0.00  0.13
 FUND EXPOSURES (WEIGHT) (Jul 18-Jun 21)  Beta  1.64  1.00  1.09
 100
 75  R-Squared  31.37  100.00  57.73
 Sharpe Ratio  0.21  0.62  0.49
 50
 25  Up Market Capture  140.07  100.00  108.61
 0  Down Market Capture  184.31  100.00  107.82
 Current       Average
 Fund  Bmk   Fund   Bmk   5 Yr  Fund  Benchmark  Peer Group
 Cash  0.0   0.0   3.5   3.5   Median
 Credit Bond  0.0   11.5   3.1   26.5   Alpha  0.86  0.00  0.55
 Govt Bond  0.0   37.6   0.0   37.2   Beta  1.38  1.00  1.10
 HY Corp Bond  100.0   15.1   91.4   10.6   R-Squared  33.79  100.00  64.22
 MBS  0.0   0.0   2.1   6.2   Sharpe Ratio  0.23  0.25  0.33
 Muni Bond  0.0   0.0   0.0   0.0   Up Market Capture  143.73  100.00  111.31
 TIPS  0.0   35.9   0.0   16.0   Down Market Capture  141.51  100.00  111.33

 Page 47