
Page 109 - AugDefComp
P. 109
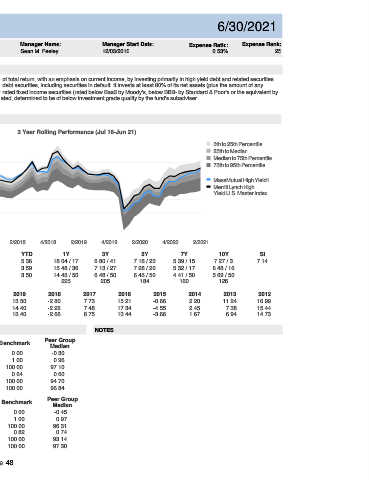
MassMutual High Yield I  MPHZX                                          6/30/2021


 Fund Incep Date:      Benchmark:     Category:     Net Assets:     Manager Name:    Manager Start Date:    Expense Ratio:  Expense Rank:
 03/01/2011  Merrill Lynch High Yield U.S. Master  High Yield Bond   $544.00M   Sean M. Feeley   12/03/2010  0.53%    25


 PORTFOLIO COMPOSITION (Holdings-based)     INVESTMENT OVERVIEW
  Assets  The investment seeks to achieve a high level of total return, with an emphasis on current income, by investing primarily in high yield debt and related securities.
 The fund invests primarily in lower rated U.S. debt securities, including securities in default. It invests at least 80% of its net assets (plus the amount of any
    Cash  2.74%       borrowings for investment purposes) in lower rated fixed income securities (rated below Baa3 by Moody's, below BBB- by Standard & Poor's or the equivalent by
    US Stocks  0.00%       any NRSRO (using the lower rating) or, if unrated, determined to be of below investment grade quality by the fund's subadviser.
    US Bonds  79.36%
    Non-US Stocks  0.46%
    Preferred Stocks  0.00%       PERFORMANCE
    Convertible Bonds  1.38%
    Other  0.00%       3 Year Rolling Performance (Jul 16-Jun 21)
    Non-US Bonds  16.06%       12
                                                                       5th to 25th Percentile
 10                                                                    25th to Median
                                                                       Median to 75th Percentile
 8                                                                     75th to 95th Percentile
 Credit Quality (%)
 AAA  0.00%  6
 AA  0.00%                                                             MassMutual High Yield I
 A  0.00%  4                                                           Merrill Lynch High
                                                                       Yield U.S. Master Index
 BBB  1.56%
 BB  30.05%  2
 B  39.54%
 0
 Below B  27.40%
 NR/NA  1.45%  -2
 Total:  100.00%
 -4
 4/2016  2/2017  4/2017  2/2018  4/2018  2/2019  4/2019  2/2020  4/2020  2/2021
 3M     YTD          1Y           3Y           5Y           7Y           10Y          SI
 Fund  3.47  5.36  18.04 / 17   6.80 / 41    7.18 / 23    5.39 / 15    7.27 / 3       7.14
 Sector (%)
 Benchmark  2.75  3.59  15.48 / 36  7.13 / 27  7.28 / 20  5.32 / 17    6.48 / 16
 % Government  0.00%
 % Municipal  0.00%  Peer Group Median  2.53  3.50  14.43 / 50  6.48 / 50  6.45 / 50  4.41 / 50  5.69 / 50
 % Corporate  97.25%  Number of Funds  225  205  184        160          126
 % Securitized  0.00%  CALENDAR  2020  2019  2018  2017  2016  2015  2014  2013       2012
 % Cash and Equivalent  2.75%  Fund  4.92  13.50  -2.80  7.73  15.21  -0.66  2.20  11.24  16.99
 % Derivative  0.00%
 Benchmark  6.20  14.40  -2.26  7.48   17.34       -4.55       2.45        7.38       15.44
 Total:  100.00%
 Peer Group Median  5.32  13.40  -2.66  6.75  13.44  -3.66     1.67        6.94       14.73

 RISK & PERFORMANCE STATISTICS   NOTES
                Peer Group
 3 Yr  Fund  Benchmark
 ASSET LOADINGS  (Returns-based)     Median
 Alpha  -0.17  0.00  -0.30
 FUND EXPOSURES (WEIGHT) (Jul 18-Jun 21)  Beta  0.97  1.00  0.96
 100
 75  R-Squared  97.63  100.00  97.10
 Sharpe Ratio  0.61  0.64  0.60
 50
 25  Up Market Capture  99.67  100.00  94.70
 0  Down Market Capture  103.60  100.00  96.84
 Current       Average
 Fund  Bmk   Fund   Bmk   5 Yr  Fund  Benchmark  Peer Group
 Cash  0.0   0.0   0.2   0.0   Median
 Credit Bond  0.0   0.0   0.0   0.0   Alpha  0.07  0.00  -0.45
 Govt Bond  0.0   0.0   0.0   0.0   Beta  0.97  1.00  0.97
 HY Corp Bond  93.2   99.4   94.2   99.7   R-Squared  97.08  100.00  96.31
 MBS  0.0   0.0   0.0   0.0   Sharpe Ratio  0.82  0.82  0.74
 Muni Bond  6.8   0.6   5.7   0.3   Up Market Capture  100.17  100.00  93.14
 TIPS  0.0   0.0   0.0   0.0   Down Market Capture  102.29  100.00  97.30

 Page 48