Page 144 - AugDefComp
P. 144

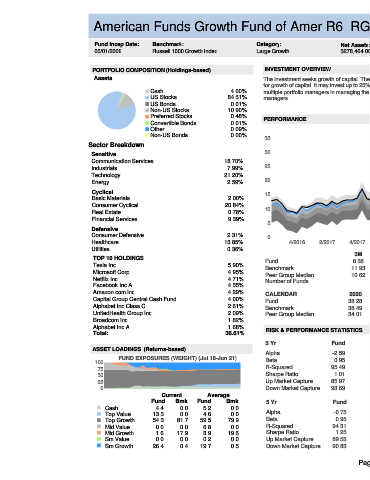
American Funds Growth Fund of Amer R6                                               RGAGX                                                                          6/30/2021


                                Fund Incep Date:      Benchmark:                     Category:                   Net Assets:      Manager Name:              Manager Start Date:          Expense Ratio:   Expense Rank:
                                05/01/2009         Russell 1000 Growth Index         Large Growth                $278,464.00M     Donald D. O'Neal           11/01/1993                          0.30%                 7


                               PORTFOLIO COMPOSITION (Holdings-based)                   INVESTMENT OVERVIEW
                                Assets                                                  The investment seeks growth of capital. The fund invests primarily in common stocks and seeks to invest in companies that appear to offer superior opportunities
                                                                                        for growth of capital. It may invest up to 25% of its assets in securities of issuers domiciled outside the United States. The investment adviser uses a system of
                                                  Cash                       4.00%       multiple portfolio managers in managing the fund's assets. Under this approach, the portfolio of the fund is divided into segments managed by individual
                                                  US Stocks                 84.51%       managers.
                                                  US Bonds                   0.01%
                                                  Non-US Stocks             10.90%
                                                  Preferred Stocks           0.48%       PERFORMANCE
                                                  Convertible Bonds          0.01%
                                                  Other                      0.09%                                               3 Year Rolling Performance (Jul 16-Jun 21)
                                                  Non-US Bonds               0.00%       35
                              Sector Breakdown                                                                                                                                                  5th to 25th Percentile
                               Sensitive                                                30                                                                                                      25th to Median
                               Communication Services                      18.70%                                                                                                               Median to 75th Percentile
                               Industrials                                  7.99%       25                                                                                                      75th to 95th Percentile
                               Technology                                  21.20%
                               Energy                                       2.59%       20                                                                                                      American Funds
                                                                                                                                                                                                Growth Fund of Amer R6
                               Cyclical                                                                                                                                                         Russell 1000 Growth Index
                                                                                        15
                               Basic Materials                              2.00%
                               Consumer Cyclical                           20.84%
                                                                                        10
                               Real Estate                                  0.78%
                               Financial Services                           9.39%
                                                                                         5
                               Defensive
                               Consumer Defensive                           2.31%        0
                               Healthcare                                  13.85%               4/2016    2/2017    4/2017    2/2018    4/2018    2/2019    4/2019    2/2020    4/2020    2/2021
                               Utilities                                    0.36%
                                                                                                                      3M          YTD           1Y           3Y           5Y           7Y          10Y           SI
                               TOP 10 HOLDINGS
                                                                                        Fund                         8.38         11.14      43.41 / 31   20.79 / 64   21.41 / 55   16.39 / 53   16.35 / 47    17.11
                               Tesla Inc                                    5.90%
                                                                                        Benchmark                    11.93        12.99      42.50 / 38   25.14 / 24   23.66 / 29   18.56 / 20   17.87 / 20
                               Microsoft Corp                               4.95%       Peer Group Median            10.62        12.78      41.03 / 50   22.57 / 50   21.74 / 50   16.66 / 50   16.20 / 50
                               Netflix Inc                                  4.71%
                                                                                        Number of Funds                                        411          376          344          323          289
                               Facebook Inc A                               4.55%
                               Amazon.com Inc                               4.29%       CALENDAR                    2020       2019        2018        2017       2016        2015       2014        2013       2012
                               Capital Group Central Cash Fund              4.00%       Fund                        38.28      28.54       -2.60      26.53       8.82        5.70        9.63       34.29      20.98
                               Alphabet Inc Class C                         2.61%       Benchmark                   38.49      36.39       -1.51      30.21       7.08        5.67       13.05       33.48      15.26
                               UnitedHealth Group Inc                       2.09%       Peer Group Median           34.01      32.41       -1.86      28.09       3.80        3.99       10.50       34.37      15.03
                               Broadcom Inc                                 1.82%
                               Alphabet Inc A                               1.68%
                                                                                         RISK & PERFORMANCE STATISTICS                                     NOTES
                               Total:                                      36.61%
                                                                                                                                          Peer Group
                                                                                        3 Yr                  Fund         Benchmark
                               ASSET LOADINGS  (Returns-based)                                                                              Median
                                                                                        Alpha                 -2.59            0.00         -1.31
                                        FUND EXPOSURES (WEIGHT) (Jul 18-Jun 21)         Beta                   0.95            1.00          0.97
                                100
                                 75                                                     R-Squared             95.49          100.00         94.47
                                                                                        Sharpe Ratio           1.01            1.17          1.08
                                 50
                                 25                                                     Up Market Capture     85.97          100.00         91.09
                                  0                                                     Down Market Capture   93.69          100.00         95.85
                                                      Current        Average
                                                   Fund    Bmk    Fund     Bmk           5 Yr                  Fund         Benchmark      Peer Group
                                   Cash             4.4     0.0     5.2      0.0                                                             Median
                                   Top Value       13.3     0.0     4.6      0.0         Alpha                 -0.75            0.00         -0.82
                                   Top Growth      54.3    81.7    59.5     79.9         Beta                   0.95            1.00          0.97
                                   Mid Value        0.0     0.0     6.8      0.0         R-Squared             94.31          100.00         93.44
                                   Mid Growth       1.6    17.9     3.9     19.6         Sharpe Ratio           1.25            1.34          1.24
                                   Sm Value         0.0     0.0     0.2      0.0         Up Market Capture     89.53          100.00         92.18
                                   Sm Growth       26.4     0.4    19.7      0.5         Down Market Capture   90.83          100.00         94.44

                                                                                                                       Page 66
   139   140   141   142   143   144   145   146   147   148   149