
Page 161 - AugDefComp
P. 161
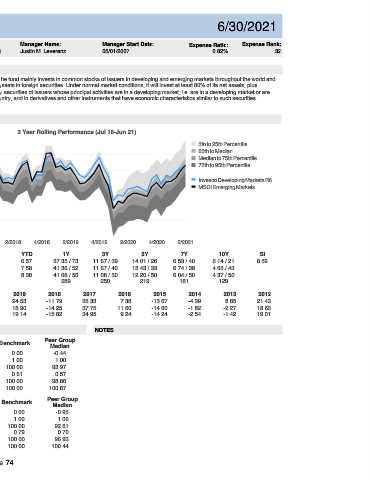
Invesco Developing Markets R6  ODVIX                                    6/30/2021


 Fund Incep Date:      Benchmark:     Category:     Net Assets:     Manager Name:    Manager Start Date:    Expense Ratio:  Expense Rank:
 12/29/2011  MSCI Emerging Markets  Diversified Emerging Mkts   $53,247.00M   Justin M. Leverenz   05/01/2007  0.82%    32


 PORTFOLIO COMPOSITION (Holdings-based)     INVESTMENT OVERVIEW
  Assets  The investment seeks capital appreciation. The fund mainly invests in common stocks of issuers in developing and emerging markets throughout the world and
 at times it may invest up to 100% of its total assets in foreign securities. Under normal market conditions, it will invest at least 80% of its net assets, plus
    Cash  2.82%       borrowings for investment purposes, in equity securities of issuers whose principal activities are in a developing market, i.e. are in a developing market or are
    US Stocks  0.00%       economically tied to a developing market country, and in derivatives and other instruments that have economic characteristics similar to such securities.
    US Bonds  0.00%
    Non-US Stocks  94.94%
    Preferred Stocks  0.01%       PERFORMANCE
    Convertible Bonds  0.00%
    Other  2.23%       3 Year Rolling Performance (Jul 16-Jun 21)
    Non-US Bonds  0.00%       20
 Sector Breakdown                                                 5th to 25th Percentile
                                                                  25th to Median
 Sensitive  15
 Communication Services  13.35%                                   Median to 75th Percentile
                                                                  75th to 95th Percentile
 Industrials  3.58%
 10
 Technology  14.12%
                                                                  Invesco Developing Markets R6
 Energy  4.05%
 5                                                                MSCI Emerging Markets
 Cyclical
 Basic Materials  5.56%
 Consumer Cyclical  24.48%  0
 Real Estate  1.80%
 Financial Services  20.37%  -5
 Defensive
 Consumer Defensive  6.44%  -10
 Healthcare  6.25%  4/2016  2/2017  4/2017  2/2018  4/2018  2/2019  4/2019  2/2020  4/2020  2/2021
 Utilities  0.00%
 3M     YTD          1Y           3Y           5Y           7Y           10Y          SI
 TOP 10 HOLDINGS
 Fund  5.66  6.57  37.35 / 73  11.67 / 39   14.01 / 26    6.53 / 40    6.14 / 21      8.59
 Taiwan Semiconductor Manufacturing Co Ltd  7.75%
 Benchmark  5.12  7.58  41.36 / 52  11.67 / 40  13.43 / 33  6.74 / 38  4.65 / 43
 Tencent Holdings Ltd  6.43%  Peer Group Median  5.00  8.38  41.68 / 50  11.08 / 50  12.20 / 50  6.04 / 50  4.37 / 50
 Housing Development Finance Corp Ltd  4.85%
 Number of Funds     289          250          219          181          129
 Kering SA  3.87%
 NOVATEK PJSC GDR  3.86%  CALENDAR  2020  2019  2018  2017  2016  2015  2014  2013    2012
 AIA Group Ltd  3.73%  Fund  17.66  24.53  -11.79  35.33  7.38  -13.67  -4.39  8.85   21.43
 Huazhu Group Ltd ADR  3.51%  Benchmark  18.69  18.90  -14.25  37.75  11.60  -14.60  -1.82  -2.27  18.63
 Yum China Holdings Inc Ordinary Shares  3.27%  Peer Group Median  16.94  19.14  -15.82  34.95  9.24  -14.24  -2.54  -1.42  19.01
 Kotak Mahindra Bank Ltd  3.25%
 Yandex NV Shs Class-A-  2.91%
 RISK & PERFORMANCE STATISTICS   NOTES
 Total:  43.44%
                Peer Group
 3 Yr  Fund  Benchmark
 ASSET LOADINGS  (Returns-based)     Median
 Alpha  0.46  0.00  -0.44
 FUND EXPOSURES (WEIGHT) (Jul 18-Jun 21)  Beta  0.95  1.00  1.00
 100
 75  R-Squared  95.43  100.00  93.97
 Sharpe Ratio  0.62  0.61  0.57
 50
 25  Up Market Capture  96.69  100.00  98.86
 0  Down Market Capture  95.92  100.00  100.87
 Current       Average
 Fund  Bmk   Fund   Bmk   5 Yr  Fund  Benchmark  Peer Group
 Cash  0.0   0.0   0.0   0.0   Median
 Europe Lg  18.6   0.0   12.5   2.2   Alpha  1.29  0.00  -0.95
 Europe Sm  8.8   0.0   9.8   0.8   Beta  0.93  1.00  1.00
 AsiaPac Lg  3.8   0.0   1.2   0.4   R-Squared  94.15  100.00  92.61
 AsiaPac Sm  0.0   0.0   0.0   0.0   Sharpe Ratio  0.85  0.79  0.70
 Emg Europe  7.1   17.2   11.1   20.2   Up Market Capture  95.05  100.00  96.93
 Emg Asia  61.8   82.8   65.4   76.4   Down Market Capture  89.68  100.00  100.44

 Page 74