
Page 133 - NovDefComp
P. 133
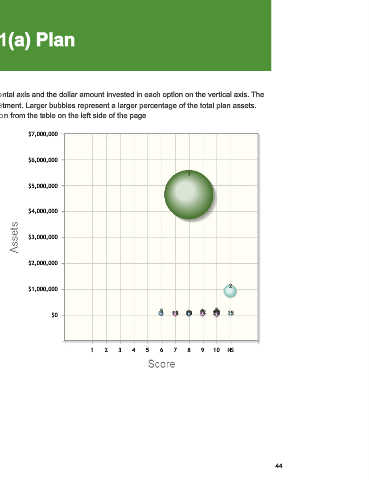
Scorecard Scatter Chart - 401(a) Plan


 This scatter chart shows each investment option with the fund score on the horizontal axis and the dollar amount invested in each option on the vertical axis. The
 size of the bubble correlates to the percentage of the overall assets in each investment. Larger bubbles represent a larger percentage of the total plan assets.
 The numbered data labels represent the ID associated with each investment option from the table on the left side of the page


          $7,000,000
 Chart ID  Investment Name

 1  Vanguard Target Retirement Series Inv
          $6,000,000
 2  SAGIC Core Bond
                                                               1
 3  Vanguard Institutional Index I
          $5,000,000
 4  Vanguard Total Stock Mkt Idx Inv
 5  American Funds Growth Fund of Amer R6
 6  Vanguard Small Cap Index I  $4,000,000

 7  Vanguard Mid Cap Index Institutional
 8  Vanguard Total Bond Market Index I  $3,000,000
 9  PIMCO Long-Term Real Return Instl

 10  Parnassus Core Equity Institutional
          $2,000,000
 11  PIMCO Total Return Instl

 12  Vanguard Developed Markets Index Inv
          $1,000,000                                                         2
 13  Hartford Healthcare HLS IA
 14  American Funds American Mutual R6
                                                                        3 4
                                                      5   18  19   6 7 12  11  15
                                                                        8 10
                                                          13
                                                                       14
                                                                       17
                                                               9 16
                                                                       20
 15  Bank of the West Savings  $0
 16  American Funds Fundamental Invs R6
 17  Small Cap Growth I1 (Victory RS SCG R6)
 18  American Funds Europacific Growth R6  1  2  3  4  5  6  7  8  9   10   NS
 19  MassMutual Select Mid Cap Growth I
 20  Invesco Developing Mkts R6


                                                                                            44