
Page 60 - NovDefComp
P. 60
Q3 2020 Market Kaleidoscope
Q3 2020 Market Kaleidoscope
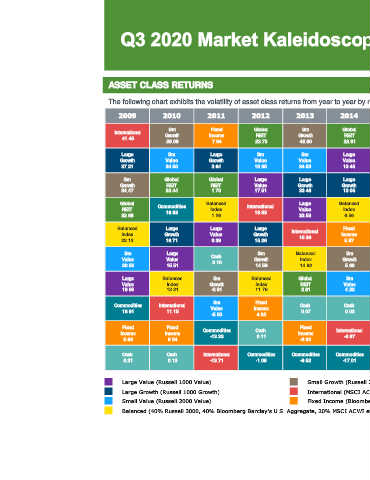
ASSET CLASS RETURNS
The following chart exhibits the volatility of asset class returns from year to year by ranking indices in order of performance, highlighting the importance of diversification.
2009 2010 2011 2012 2013 2014 2015 2016 2017 2018 2019 YTD
Sm Fixed Global Sm Global Large Sm Large Large Large
International Cash
41.45 Growth Income REIT Growth REIT Growth Value Growth 1.87 Growth Growth
29.09 7.84 23.73 43.30 22.81 5.67 31.74 30.21 36.39 24.33
Large Sm Large Sm Sm Large Global Large International Fixed Sm Fixed
Growth Value Growth Value Value Value REIT Value 27.19 Income Growth Income
37.21 24.50 2.64 18.05 34.52 13.45 0.59 17.34 0.01 28.48 6.79
Sm Global Global Large Large Large Fixed Sm Large Large Balanced
Growth REIT REIT Value Growth Growth Income Commodities Growth Growth Value Index
11.77
34.47 23.44 1.70 17.51 33.48 13.05 0.55 22.17 -1.51 26.54 5.04
Global Commodities Balanced International Large Balanced Cash Sm Balanced Balanced Global Sm
REIT 16.83 Index 16.83 Value Index 0.05 Growth Index Index REIT Growth
33.68 1.26 32.53 6.56 11.32 15.00 -4.70 24.49 3.88
Balanced Large Large Large International Fixed Balanced Large Large Global Sm Cash
Index Growth Value Growth 15.29 Income Index Growth Value REIT Value 0.64
22.12 16.71 0.39 15.26 5.97 -0.55 7.08 13.66 -4.77 22.39
Sm Large Cash Sm Balanced Sm Sm Balanced Global Large International International
Value Value 0.10 Growth Index Growth Growth Index REIT Value 21.51 -5.44
20.58 15.51 14.59 14.92 5.60 -1.38 7.06 8.63 -8.27
Large Balanced Sm Balanced Global Sm Large Global Sm Sm Balanced Large
Value Index Growth Index REIT Value Value REIT Value Growth Index Value
19.69 12.21 -2.91 11.76 2.81 4.22 -3.83 6.90 7.84 -9.31 20.02 -11.58
Sm Fixed Fixed Fixed
Commodities International Cash Cash International International Commodities Commodities
18.91 11.15 Value Income 0.07 0.03 -5.66 4.50 Income -11.25 Income -12.08
-5.50 4.22 3.54 8.72
Fixed Fixed Commodities Cash Fixed International Sm Fixed Commodities Sm Commodities Global
Income Income -13.32 0.11 Income -3.87 Value Income 1.70 Value 7.69 REIT
5.93 6.54 -2.02 -7.47 2.65 -12.86 -18.56
Sm
Cash Cash International Commodities Commodities Commodities Commodities Cash Cash International Cash Value
0.21 0.13 -13.71 -1.06 -9.52 -17.01 -24.66 0.33 0.86 -14.20 2.28
-21.54
Large Value (Russell 1000 Value) Small Growth (Russell 2000 Growth) Global REIT (S&P Global REIT)
Large Growth (Russell 1000 Growth) International (MSCI ACWI ex-US) Commodities (Bloomberg Commodities)
Small Value (Russell 2000 Value) Fixed Income (Bloomberg Barclays Agg) Cash (Merrill Lynch 3-Mo T-Bill)
Balanced (40% Russell 3000, 40% Bloomberg Barclay’s U.S. Aggregate, 20% MSCI ACWI ex US)
8