Page 56 - NovDefComp
P. 56

Q3 2020 Market Review – International Equity
                                        Q3 2020 Market Review - International Equity


                                     INTERNATIONAL EQUITY

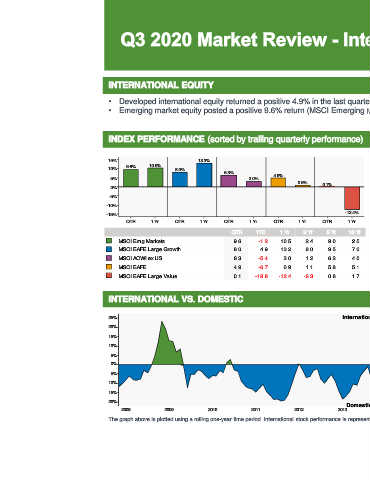
                                     •  Developed international equity returned a positive 4.9% in the last quarter (MSCI EAFE).
                                     •  Emerging market equity posted a positive 9.6% return (MSCI Emerging Markets Index).


                                     INDEX PERFORMANCE (sorted by trailing quarterly performance)                              DEVELOPED VS. EMERGING MARKETS


                                                                                                                               30%                                Developed Outperforms
                                     15%                          13.2%                                                        20%
                                     10%   9.6%   10.5%    8.0%
                                                                           6.3%                                                10%
                                     5%                                            3.0%    4.9%                                0%
                                                                                                   0.9%    0.1%                10%
                                     0%
                                                                                                                               20%
                                     -5%                                                                                       30%
                                    -10%                                                                                       40%
                                                                                                                               50%                                Emerging Outperforms
                                    -15%                                                                           -12.4%
                                                                                                                                  2008  2009   2010   2011   2012  2013   2014   2015   2016  2017   2018   2019
                                           QTR     1 Yr    QTR     1 Yr    QTR     1 Yr    QTR     1 Yr    QTR      1 Yr
                                                                                                                               Over the last year, emerging market stocks outperformed developed international
                                                                             QTR     YTD     1 Yr    3 Yr    5 Yr   10 Yr      stocks by 9.6%.
                                        MSCI Emg Markets                      9.6     -1.2   10.5     2.4    9.0     2.5       For the trailing quarter, emerging market stocks outperformed developed
                                        MSCI EAFE Large Growth                8.0      4.9   13.2     8.0    9.5     7.0       international stocks by 4.7%.
                                        MSCI ACWI ex US                       6.3     -5.4    3.0     1.2    6.2     4.0
                                        MSCI EAFE                             4.9     -6.7    0.9     1.1    5.8     5.1       The graph above is plotted using a rolling one-year time period. Developed
                                        MSCI EAFE Large Value                 0.1    -18.6   -12.4   -6.3    0.8     1.7       international stock performance is represented by the MSCI EAFE Index. Emerging
                                                                                                                               market stock performance is represented by the MSCI Emerging Markets Index.

                                     INTERNATIONAL VS. DOMESTIC


                                     25%                                                                          International Outperforms
                                     20%
                                     15%
                                     10%
                                     5%
                                     0%
                                     5%
                                     10%
                                     15%
                                     20%
                                                                                                                   Domestic Outperforms
                                         2008          2009           2010          2011          2012          2013           2014          2015          2016           2017          2018          2019
                                     The graph above is plotted using a rolling one-year time period. International stock performance is represented by the MSCI ACWI ex U.S. Index. Domestic stock performance is represented by the Russell 3000 Index.


                                                                                                                                                                                                                       6
   51   52   53   54   55   56   57   58   59   60   61