
Page 350 - DCAC February 2024 Files
P. 350
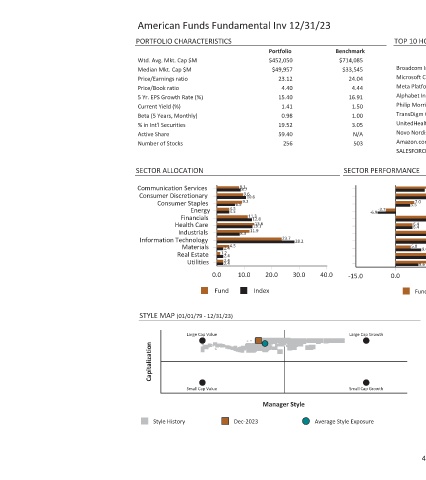
TOP 10 HOLDINGS  Quarterly Benchmark  Portfolio  Return (%) Weight (%) Weight (%)  35.01  1.22  6.52 Broadcom Inc  19.34  6.98  6.11 Microsoft Corp  17.90  1.96  2.61 Meta Platforms Inc  6.89  1.75  2.55 Alphabet Inc  3.06  0.36  2.41 Philip Morris International Inc  24.37  0.14  1.93 TransDigm Group Inc  4.78  1.22  1.86 UnitedHealth Group Incorporated  12.55  0.00  1.75 Novo Nordisk A/S  19.52  3.45  1.44 Amazon.com


             Benchmark  $714,085  $33,545  24.04  4.44  16.91  1.50  1.00  3.05  N/A  503  SECTOR PERFORMANCE  -3.7  -6.9  -15.0  Large Cap Growth  Small Cap Growth  Average Style Exposure


                                                               40.0
       American Funds Fundamental Inv 12/31/23

                                                        28.2   30.0
             Portfolio  $452,050  $49,957  23.12  4.40  15.40  1.41  0.98  19.52  59.40  256  23.7  20.0  Manager Style


                                                   12.8  13.6  13.1  11.9  Index
                                              10.6  11.3
                                           8.1  8.7  9.6  9.2  8.3  10.0                        Dec-2023
                                                4.5 6.5  4.5  4.5  2.4  1.2  2.4  2.4  2.4  0.0  Fund
           PORTFOLIO CHARACTERISTICS  Wtd. Avg. Mkt. Cap $M  Median Mkt. Cap $M  Price/Earnings ratio  Price/Book ratio  5 Yr. EPS Growth Rate (%)  Current Yield (%)  Beta (5 Years, Monthly)  % in Int'l Securities  Active Share  Number of Stocks  SECTOR ALLOCATION  Communication Services Consumer Discretionary  Consumer Staples  Energy  Financials  Health Care  Industrials Information Technology  Materials  Real Estate  Utilitie