Page 352 - DCAC February 2024 Files
P. 352

24.0
                                             20.0
                                               Risk (Standard Deviation %)
                                             16.0
           (5 YEARS*)
                                             12.0
                                             8.0
           RISK VS. RETURN
                                             4.0
                                           6.0
                    18.0
              21.0
                          15.0
                                12.0
                                     9.0
                               Return  (%)
                                                  Years
                                                10
                                                  Years
                                                7
                                                  Years
                                                5
                                                  Years
                                                3
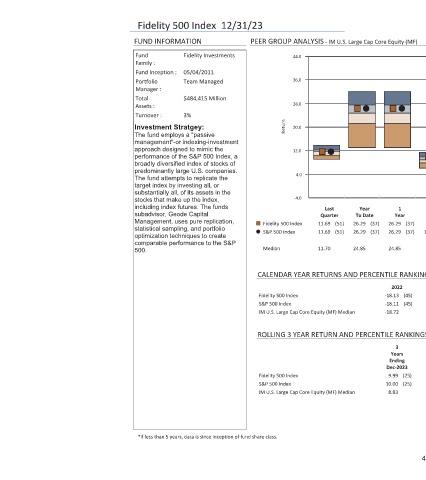
           PEER GROUP ANALYSIS - IM U.S. Large Cap Core Equity (MF)
                                                    (37) Standard  Return  Deviation  (13)  12.02  (26)  13.40  (25)  15.68  (25)  9.99  18.37  15.68 Fidelity 500 Index      (13)  12.03  (26)  13.42  (25)  15.69  (25)  10.00  (37)  18.37  15.69 S&P 500 Index      18.29  14.61  Median  10.94  12.52  14.61  8.83    2016  2017  2018  2019  2020  2021  (20)  11.97  (45)  21.81  (32)  -4.40  (37)  31.47  (50)  18.40  (26)  28.69
                                                1  Year  26.29  26.29  24.85  2022  -18.13  -18.11  -18.72  3  Years  Ending  Dec-2023  9.99  10.00  8.83
                                                    (37)  (37)
                                                Year  To Date  26.29  26.29  24.85
                                                    (51)  (51)  CALENDAR YEAR RETURNS AND PERCENTILE RANKINGS  ROLLING 3 YEAR RETURN AND PERCENTILE RANKINGS
                                                Last  Quarter  11.69  11.69  11.70
                                                    Fidelity 500 Index      S&P 500 Index      Median  Fidelity 500 Index  S&P 500 Index  Fidelity 500 Index  S&P 500 Index
              44.0  36.0  28.0  20.0  12.0  4.0  -4.0                   IM U.S. Large Cap Core Equity (MF) Median  IM U.S. Large Cap Core Equity (MF) Median
                               Return
       Fidelity 500 Index  12/31/23  FUND INFORMATION  Fidelity Investments  Fund  Family :  05/04/2011 Fund Inception :  Team Managed Portfolio  Manager :  $484,415 Million  Total  Assets :  3% Turnover :  Investment Stratgey: The fund employs a "passive management"-or indexing-investment approach designed to mimic the performance of the S&P 500 Index, a broadly diversified index of stocks of predominantly large U.S. companies.
   347   348   349   350   351   352   353   354   355   356   357