
Page 351 - DCAC February 2024 Files
P. 351
2.0 150.0
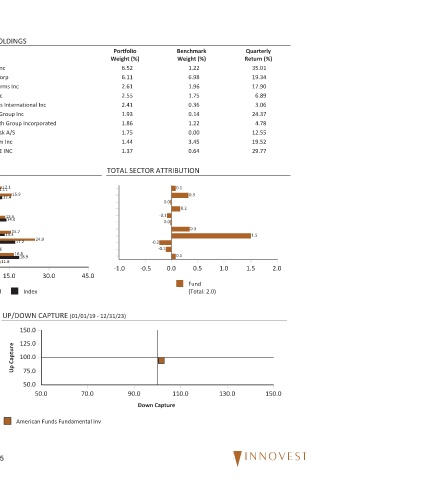
Quarterly Return (%) 35.01 19.34 17.90 6.89 3.06 24.37 4.78 12.55 19.52 29.77 1.5 1.5
1.0 130.0
Benchmark Weight (%) 1.22 6.98 1.96 1.75 0.36 0.14 1.22 0.00 3.45 0.64 0.1 0.3 0.0 0.2 -0.1 0.0 0.3 -0.1 0.1 0.5 0.0 Fund (Total: 2.0) 110.0
Portfolio Weight (%) 6.52 6.11 2.61 2.55 2.41 1.93 1.86 1.75 1.44 1.37 TOTAL SECTOR ATTRIBUTION -0.2 -0.5 -1.0 90.0 Down Capture
45.0 30.0 (01/01/19 - 12/31/23) 70.0 American Funds Fundamental Inv
TOP 10 HOLDINGS Broadcom Inc Microsoft Corp Meta Platforms Inc Alphabet Inc Philip Morris International Inc TransDigm Group Inc UnitedHealth Group Incorporated Novo Nordisk A/S Amazon.com Inc SALESFORCE INC 12.1 11.1 15.9 12.4 7.0 5.5 13.5 14.0 6.4 6.4 15.7 13.3 24.9 17.2 5.8 9.6 16.8 18.9 11.8 8.6 15.0 0.0 Index Fund UP/DOWN CAPTURE 150.0 125.0 100.0 Up Capture 75.0 50.0 50.0
Benchmark $714,085 $33,545 24.04 4.44 16.91 1.50 1.00 3.05 N/A 503 SECTOR PERFORMANCE -3.7 -6.9 -15.0 Large Cap Growth Small Cap Growth Average Style Exposure
40.0
American Funds Fundamental Inv 12/31/23
28.2 30.0
Portfolio $452,050 $49,957 23.12 4.40 15.40 1.41 0.98 19.52 59.40 256 23.7 20.0 Manager Style
12.8 13.6 13.1 11.9 Index
10.6 11.3
8.1 8.7 9.6 9.2 8.3 10.0 Dec-2023
4.5 6.5 4.5 4.5 2.4 1.2 2.4 2.4 2.4 0.0 Fund
PORTFOLIO CHARACTERISTICS Wtd. Avg. Mkt. Cap $M Median Mkt. Cap $M Price/Earnings ratio Price/Book ratio 5 Yr. EPS Growth Rate (%) Current Yield (%) Beta (5 Years, Monthly) % in Int'l Securities Active Share Number of Stocks SECTOR ALLOCATION Communication Services Consumer Discretionary Consumer Staples Energy Financials Health Care Industrials Information Technology Materials Real Estate Utilitie