
Page 147 - AugDefComp
P. 147
American Century Mid Cap Value R6 AMDVX 6/30/2021
Fund Incep Date: Benchmark: Category: Net Assets: Manager Name: Manager Start Date: Expense Ratio: Expense Rank:
07/26/2013 Russell Mid-Cap Value Index Mid-Cap Value $8,761.00M Phillip N. Davidson 03/31/2004 0.63% 23
PORTFOLIO COMPOSITION (Holdings-based) INVESTMENT OVERVIEW
Assets The investment seeks long-term capital growth; income is a secondary consideration. Under normal market conditions, the portfolio managers will invest at least
80% of the fund's net assets in medium size companies. The portfolio managers consider medium size companies to include those whose market capitalizations
Cash 1.24% at the time of purchase are within the capitalization range of the Russell 3000® Index, excluding the largest 100 such companies.
US Stocks 85.02%
US Bonds 0.00%
Non-US Stocks 13.74%
Preferred Stocks 0.00% PERFORMANCE
Convertible Bonds 0.00%
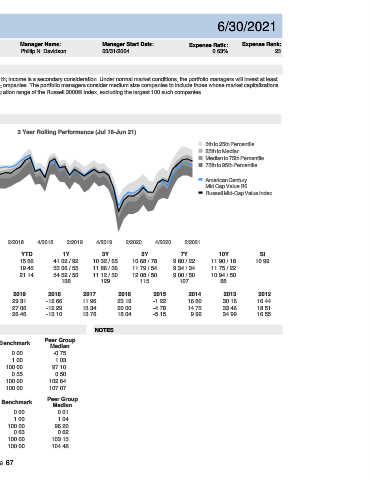
Other 0.00% 3 Year Rolling Performance (Jul 16-Jun 21)
Non-US Bonds 0.00% 20
Sector Breakdown 5th to 25th Percentile
Sensitive 15 25th to Median
Communication Services 1.35% Median to 75th Percentile
Industrials 18.36% 10 75th to 95th Percentile
Technology 5.92%
Energy 4.64% 5 American Century
Mid Cap Value R6
Cyclical Russell Mid-Cap Value Index
0
Basic Materials 2.35%
Consumer Cyclical 8.81%
-5
Real Estate 5.18%
Financial Services 19.56%
-10
Defensive
Consumer Defensive 9.52% -15
Healthcare 16.54% 4/2016 2/2017 4/2017 2/2018 4/2018 2/2019 4/2019 2/2020 4/2020 2/2021
Utilities 7.76%
3M YTD 1Y 3Y 5Y 7Y 10Y SI
TOP 10 HOLDINGS
Fund 3.29 15.86 41.02 / 92 10.32 / 65 10.68 / 78 9.80 / 22 11.90 / 18 10.99
Zimmer Biomet Holdings Inc 3.02%
Benchmark 5.66 19.45 53.06 / 55 11.86 / 36 11.79 / 54 9.34 / 34 11.75 / 22
Bank of New York Mellon Corp 2.54% Peer Group Median 4.90 21.14 54.52 / 50 11.12 / 50 12.08 / 50 9.00 / 50 10.94 / 50
Northern Trust Corp 2.19%
Number of Funds 138 129 115 107 88
Emerson Electric Co 2.10%
Chubb Ltd 2.01% CALENDAR 2020 2019 2018 2017 2016 2015 2014 2013 2012
Advance Auto Parts Inc 1.98% Fund 1.97 29.31 -12.66 11.96 23.19 -1.22 16.80 30.16 16.44
Conagra Brands Inc 1.94% Benchmark 4.96 27.06 -12.29 13.34 20.00 -4.78 14.75 33.46 18.51
Cerner Corp 1.91% Peer Group Median 3.56 26.46 -13.10 13.76 18.04 -5.15 9.92 34.99 16.55
Quest Diagnostics Inc 1.90%
Universal Health Services Inc Class B 1.89%
RISK & PERFORMANCE STATISTICS NOTES
Total: 21.48%
Peer Group
3 Yr Fund Benchmark
ASSET LOADINGS (Returns-based) Median
Alpha -0.52 0.00 -0.75
FUND EXPOSURES (WEIGHT) (Jul 18-Jun 21) Beta 0.89 1.00 1.03
100
75 R-Squared 96.89 100.00 97.10
Sharpe Ratio 0.51 0.55 0.50
50
25 Up Market Capture 91.50 100.00 102.64
0 Down Market Capture 95.66 100.00 107.07
Current Average
Fund Bmk Fund Bmk 5 Yr Fund Benchmark Peer Group
Cash 4.7 0.0 3.5 0.0 Median
Top Value 44.7 0.0 37.6 0.0 Alpha -0.04 0.00 0.01
Top Growth 0.0 0.0 0.3 0.0 Beta 0.89 1.00 1.04
Mid Value 50.6 100.0 49.6 100.0 R-Squared 96.19 100.00 96.20
Mid Growth 0.0 0.0 1.9 0.0 Sharpe Ratio 0.62 0.63 0.62
Sm Value 0.0 0.0 7.2 0.0 Up Market Capture 90.82 100.00 103.15
Sm Growth 0.0 0.0 0.0 0.0 Down Market Capture 93.00 100.00 104.48
Page 67